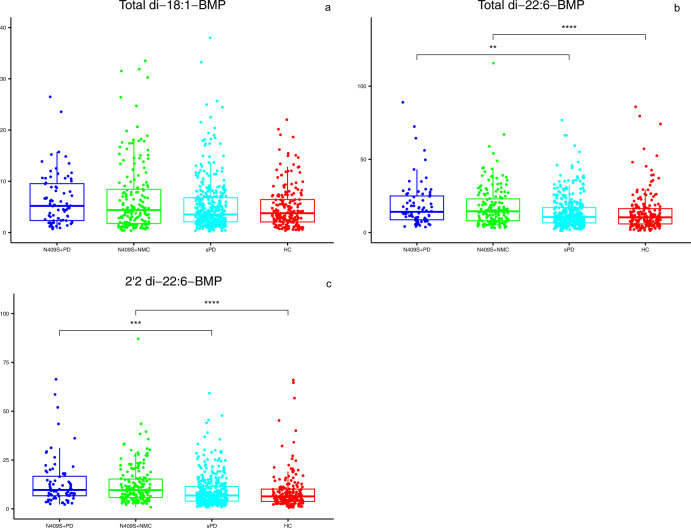
Fig. 2. Levels of three BMP isoforms in GBA1 N409S carriers compared to HC and sPD.
a–c Plots show baseline concentrations of each specific BMP isoform measured in the 4 groups indicated on the X-axis. Box-and-whisker plots with scatter plots superimposed are shown with filled circles representing observed data. The bottom and top edges of the box correspond to the 75th and 25th percentiles, respectively. The horizontal line within the box indicates the median. The whiskers indicate the range of values within 1.5 times the interquartile range. Mann–Whitney U-test was used for pairwise comparisons. The significance level for pairwise comparisons is p value <0.0125 (after Bonferroni correction). ****p value <0.0001, ***p value <0.0005, and **p value <0.005.

