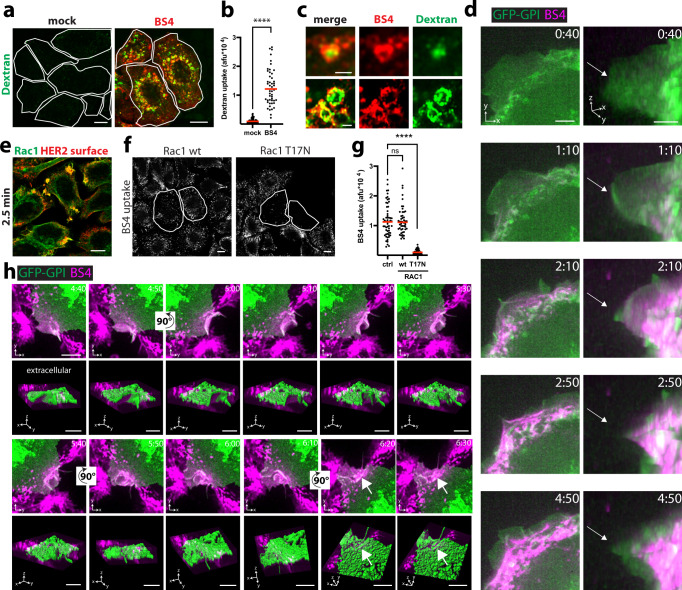
Fig. 2. Plasma membrane rearrangements during BS4 uptake are Rac1-dependent and morphologically resemble macroendocytosis.
a, b BS4 stimulates fluid-phase uptake. SkBr3 cells were co-incubated with dextran (70 kDa)-TMR and BS4-dylight650 for 10 min and after fixation analysed by confocal microscopy (a). The TMR channel is false-colour-coded in green, and individual cells are outlined. b Quantification of dextran (70 kDa)-TMR endocytosis in absence (mock) and presence of BS4 (dots represent measurements from individual cells, red lines indicate the median; n ≥ 50 cells from three independent experiments, ****P < 0.0001, two-tailed unpaired Student’s t test). c BS4-positive endocytic carriers exhibit dextran-filled lumina. d Concentration of surface-bound BS4 by inwards moving lamellipodium wave. Cells expressing GPI membrane-bound GFP (green) were imaged immediately after addition of BS4-dylight650 (magenta) (see also Supplementary Movies 3 and 4). 3D views (x, y, z dimensions) are shown on the right. The arrows indicate the position of the plasma membrane edge at the 40 s timepoint. e Rac1 re-localises to BS4-induced HER2 cell-surface aggregates. SkBr3 cells were incubated with BS4 for 2.5 min, fixed, stained for surface HER2 (red) and endogenous RAC (green) and analysed by confocal microscopy. BS4 endocytosis depends on Rac1 GTPase activity (f, g). SkBr3 cells transfected with Rac1 wt or dominant-negative T17N C-terminally GFP-tagged expression constructs were incubated with dylight650-labelled BS4 for 10 min. Samples were fixed, surface-bound BS4 was counterstained and cell sections analysed by confocal microscopy (f). Subtraction of surface from total BS4 signal shows endocytosed pool (BS4 uptake), transfected cells are outlined. Results are quantified in panel g, dots representing measurements from individual cells, red lines indicate the median; n ≥ 50 cells from three independent experiments, ns (non-significant) P > 0.05, ****P < 0.0001; one-way ANOVA with Dunnett’s multiple comparison test. BS4 is internalised via macroendocytic cups (h). SkBr3 cells expressing GFP-GPI (green) were imaged after addition of BS4-dylight650 (magenta) (see also Supplementary Movie 6). Maximum intensity projections are shown and 3D views with surface rendering of the plasma membrane (green) below each panel (see also Supplementary Movie 7). The arrows indicate the concentration of BS4 in endocytic vesicles after internalisation. Scale bars: 10 µm (a, e, f), 1 µm (c), 5 µm (d, h). Source data are provided as a Source Data file.

