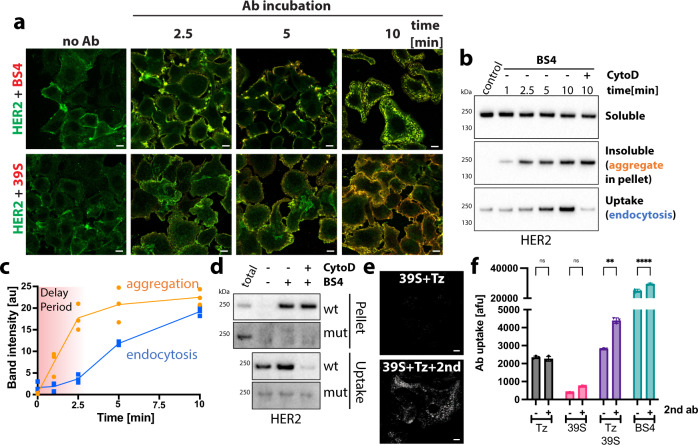
Fig. 3. BS4-induced aggregation is the trigger for HER2 endocytosis.
a BS4 clusters HER2 in the plasma membrane prior to endocytosis. SkBr3 cells were incubated with HER2-specific, dylight650-labelled biparatopic antibody BS4 or monotopic antibody 39 S for indicated times. After fixation, total HER2 in cell sections was stained using an antibody against the cytoplasmic domain and samples were analysed by confocal microscopy. b, c Aggregation of HER2 receptors by BS4 precedes endocytosis. After surface biotinylation, SkBr3 cells were incubated with BS4 for indicated times, surface remaining biotin was removed and samples lysed in low detergent buffer. A fraction was spun to separate soluble (Sup) from insoluble/aggregated proteins (Pellet). Protein in the remaining sample was solubilised (see “Methods” for protocol) and endocytosed biotinylated proteins concentrated on Streptavidin beads (uptake). Samples were assayed by immunoblot for the HER2 protein (b). c Time dependence of BS4-triggered aggregation and endocytosis of HER2 receptor is quantified (means ± SD, n = 3 independent experiments). d BS4-triggered cross-linking and endocytosis of HER2 is abrogated for mutant HER2 lacking the Tz-binding site. CHO cells expressing full-length HER2 receptor, either wt or lacking the Tz-binding site, were surface biotinylated and incubated with BS4 for 10 min. Samples were analysed as described in (b). e, f Cross-linking of both monotopic antibodies phenocopies the effect of BS4 on HER2 aggregation and endocytosis. Cells were incubated with equal amounts of indicated antibodies, with or without a cross-linking anti-human Alexa488 antibody (2nd) for 1 h. After fixation surface-bound, dylight650-labelled antibody was quenched and cell sections analysed by confocal microscopy (e) or antibody uptake quantified by flow cytometry (f) (means ± SD, n = 3 independent experiments, ns (non-significant) P > 0.05, **P = 0.0025, ****P < 0.0001, two-way ANOVA with Sidak’s multiple comparison test). Scale bars: 10 µm. Source data are provided as a Source Data file.

