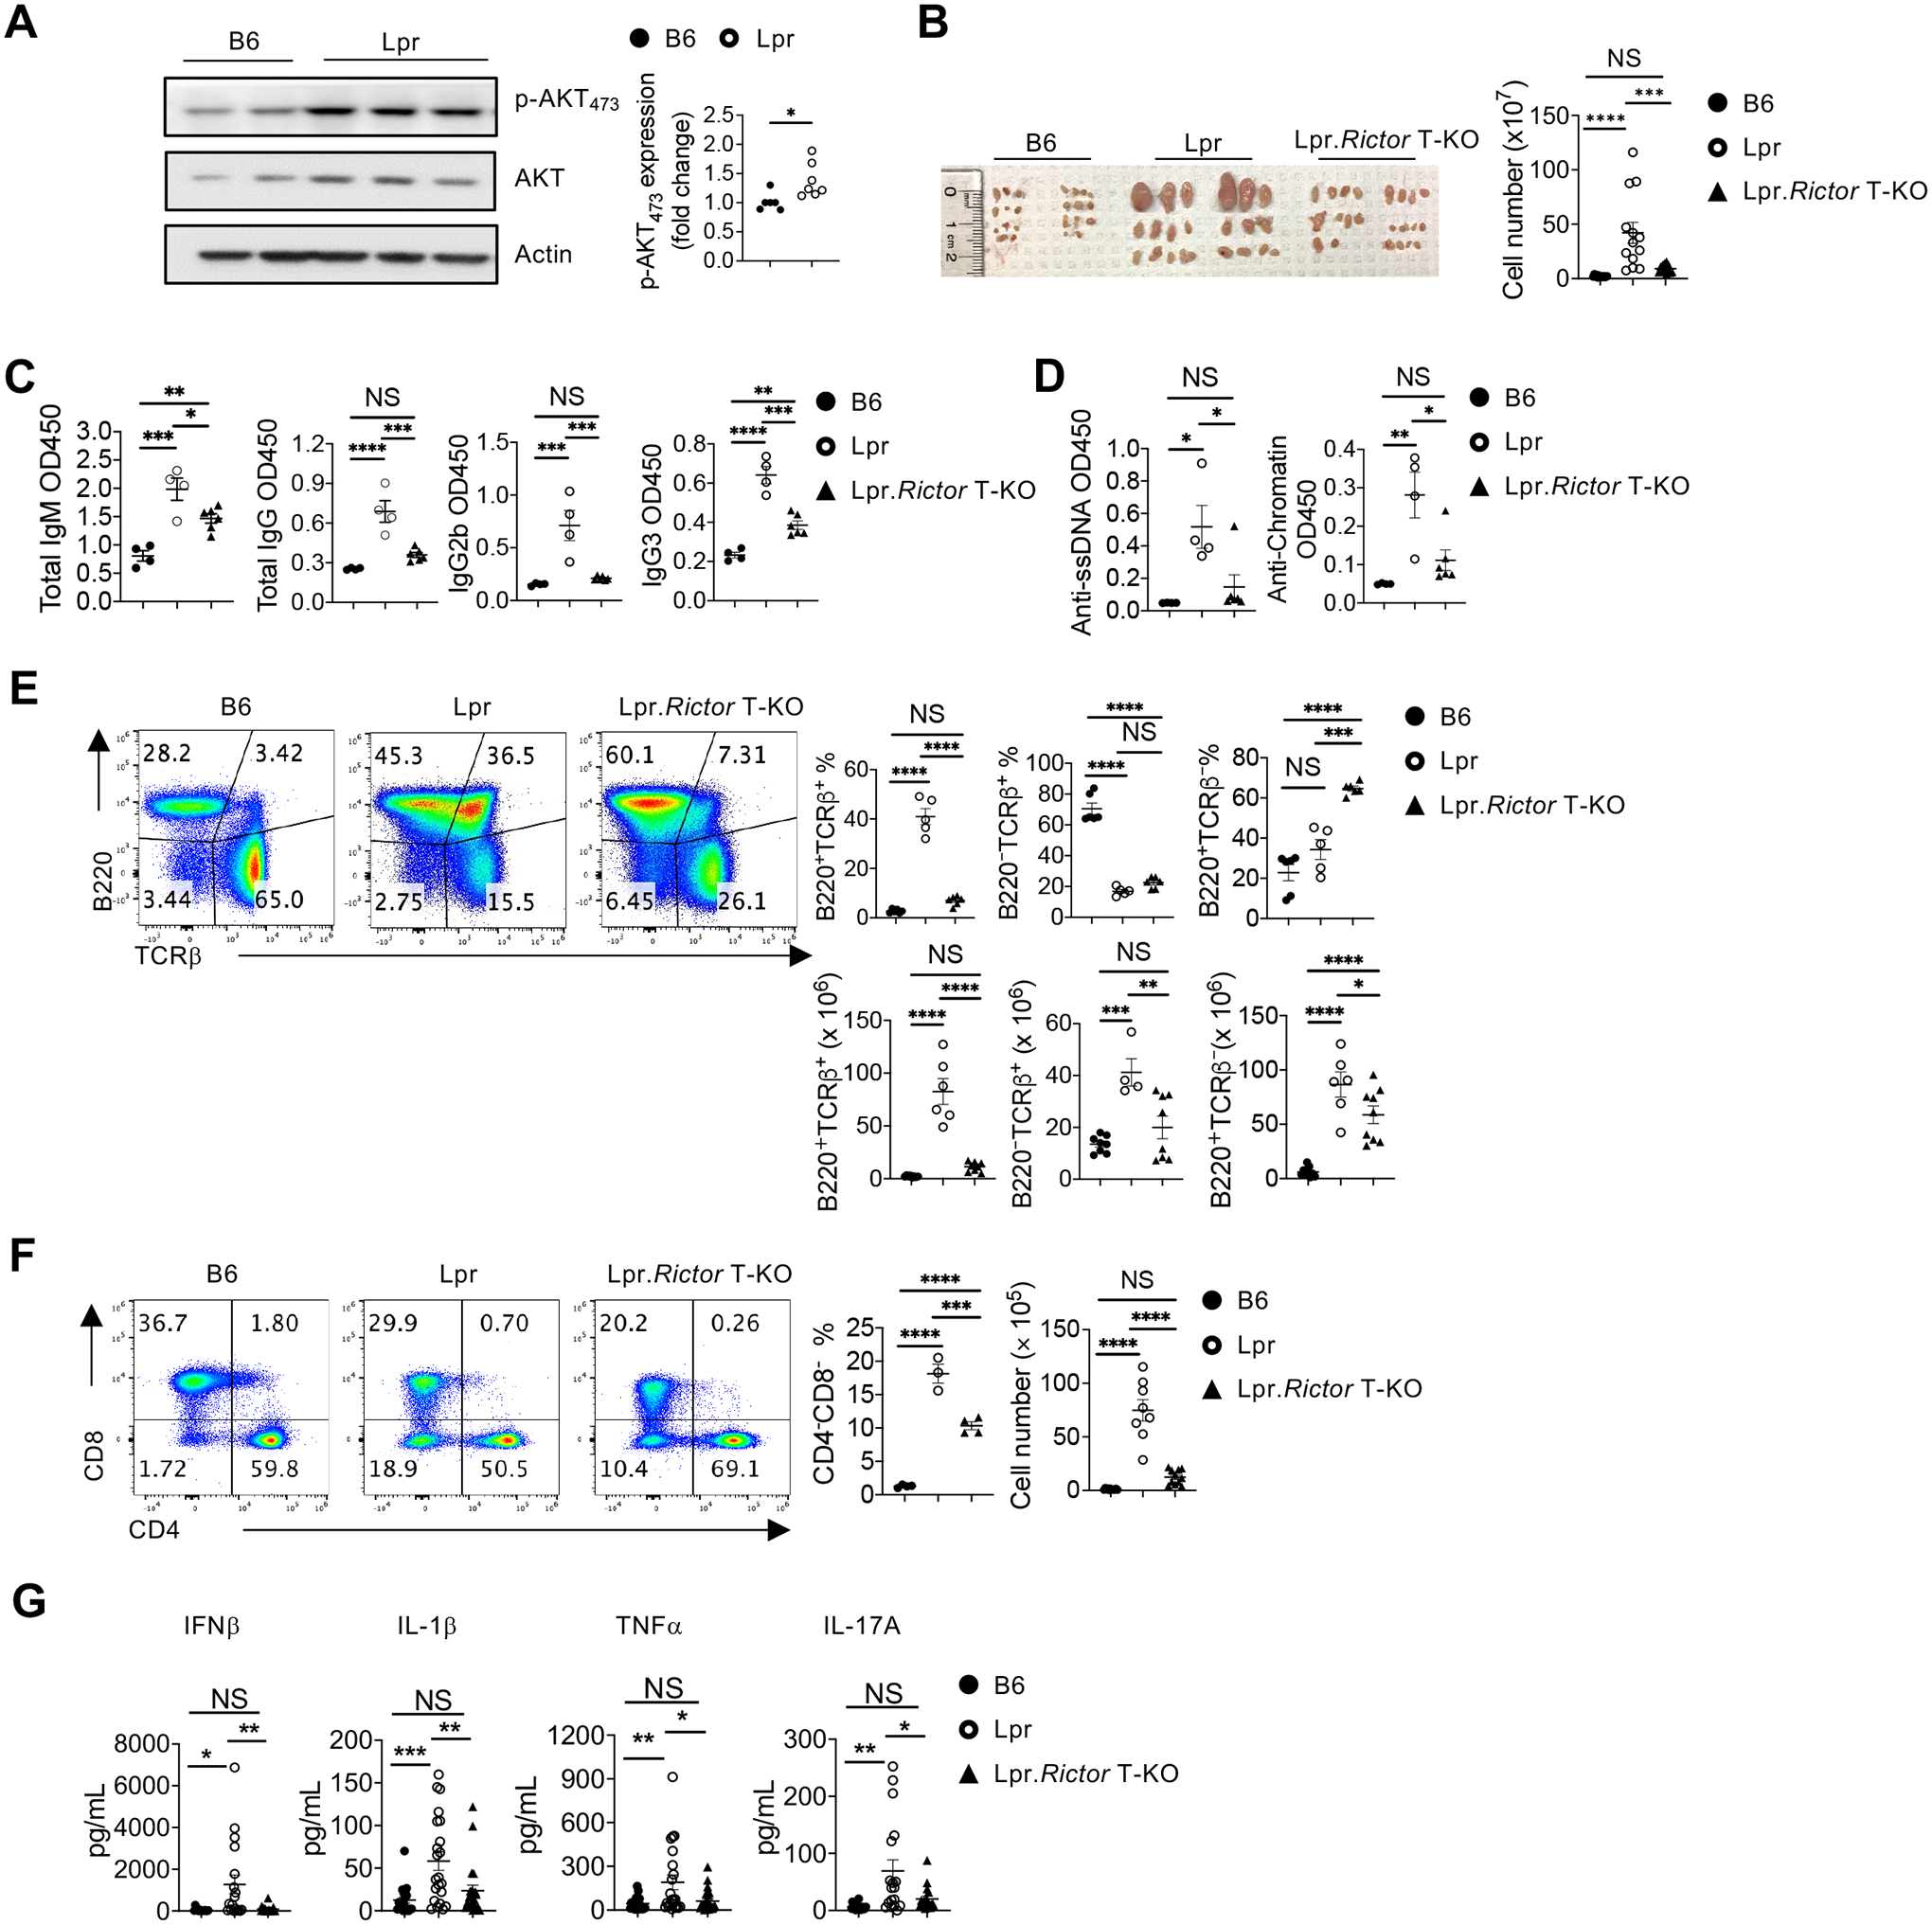
Figure 1. Rictor deletion in T cells rectifies immunopathology in Lpr mice.

(A) Immunoblot analysis of p-AKT473 in B6 and Lpr CD4+ T cells isolated from peripheral lymph nodes (pLN). Right, summary of the relative p-AKT473 expression (normalized to that in B6 CD4+ T cells). (B) Image of peripheral lymph nodes taken from 6 months old B6, Lpr and Lpr.Rictor T-KO mice. Right, summary of total cellularity of lymph nodes. (C) Titers of immunoglobulin (Ig) M, IgG1, IgG2a, IgG2b and IgA were measured by ELISA. (D) Titers of anti-ssDNA (left) and anti-chromatin (right) were measured by ELISA. Samples were from 9 months old B6, Lpr and Lpr.Rictor T-KO mice. (E) Expression of B220 and TCRβ on lymphocytes. Right, the frequencies (upper panels) and absolute numbers (lower panels) of B220+TCRβ+, B220–TCRβ+, B220+TCRβ– cells. (F) Flow cytometry analysis of CD4 and CD8 T cells among B220–TCRβ+ cells. Right, the frequency (left) and absolute number (right) of CD4–CD8– T cell population. (E) and (F) Cells were from peripheral lymph nodes (pLN) of 6 months old B6, Lpr and Lpr.Rictor T-KO mice. (G) The inflammatory cytokine levels in mouse sera samples collected from 5–6 months old B6, Lpr and Lpr.Rictor T-KO mice. NS, not significant; * P < 0.05, ** P < 0.01, *** P < 0.001, **** P < 0.0001. p values were calculated with one-way ANOVA. Results were presentative of 3 (A) independent experiment and pooled from at least 3 (A-G) independent experiments. Error bars represent SEM.
