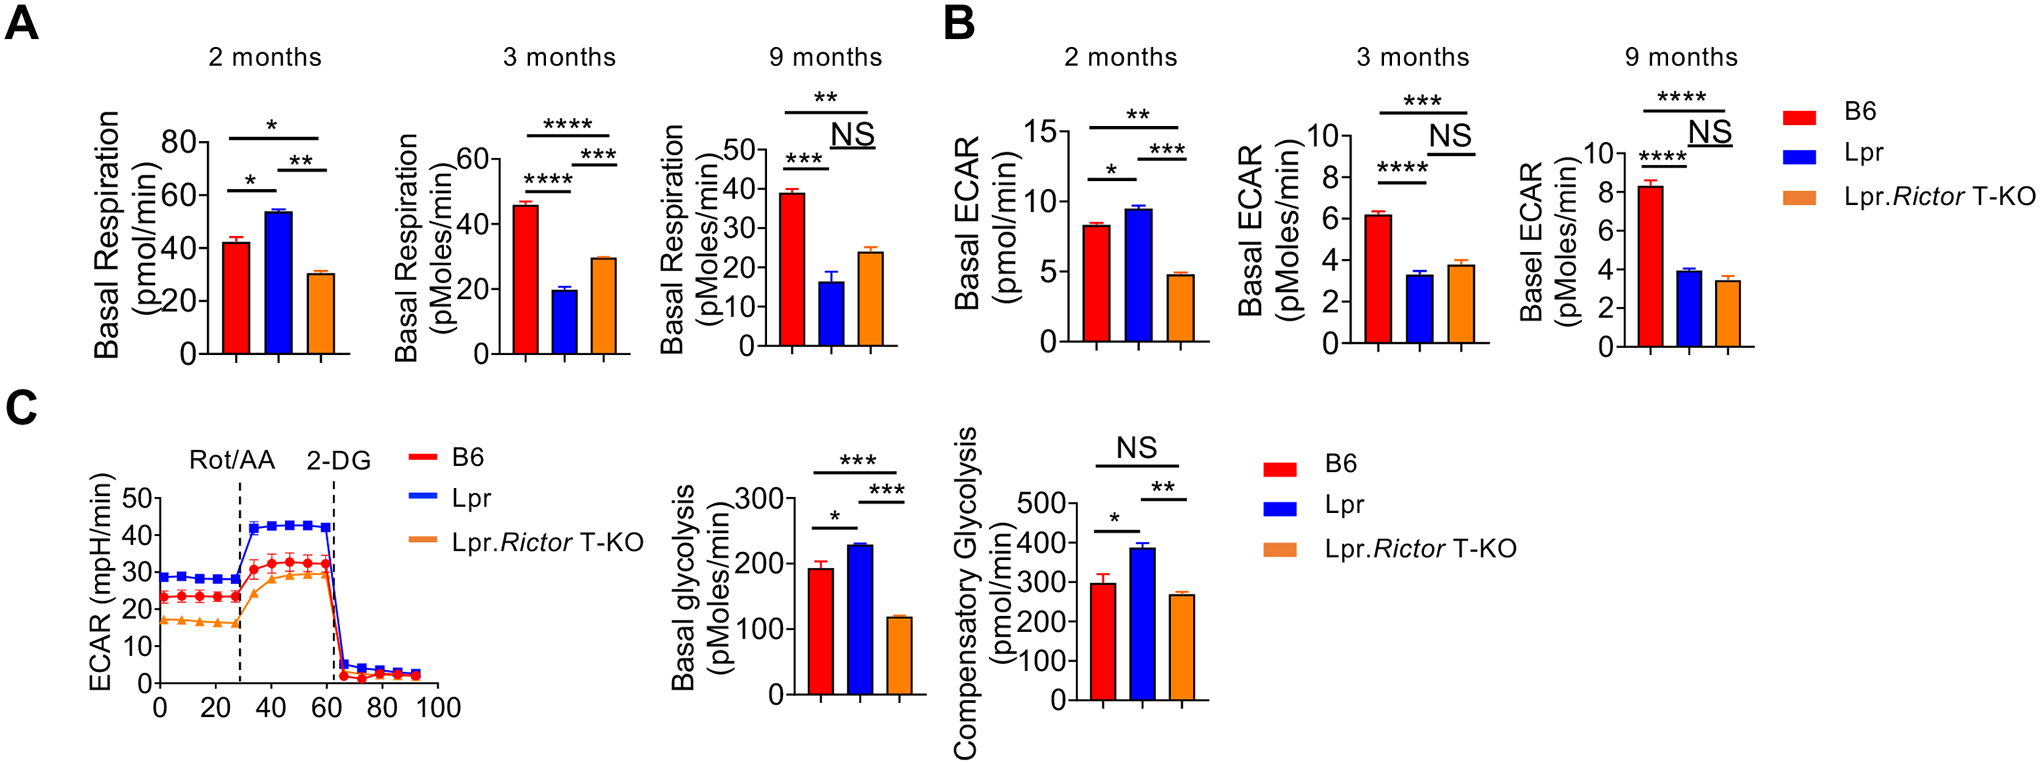
Figure 5. mTORC2 supports TCR/ICOS mediated glucose metabolism in Lpr T cells.

(A) The basal respiration and (B) basal extracellular acidification rate (ECAR) of CD4+ T from 2-, 3-, and 9-months old mice cells under anti-CD3/anti-CD28 overnight activation, respectively. (C) The ECAR of CD4+ T cells followed by sequential anti-CD3/anti-CD28, and anti-CD3/anti-ICOS stimulation measured by glycolytic rate assay. Cells were from pLNs of 6 months old B6, Lpr and Lpr.Rictor T-KO mice. Right, summaries of basal glycolysis and compensatory glycolysis. Rot, Rotenone; AA, Antimycin A; 2-DG, 2-deoxyglucose. NS, not significant; * P < 0.05, ** P < 0.01, *** P < 0.001, **** P < 0.0001 (one-way ANOVA). Results were presentative of 2 (A-B) and 3 (C) independent experiments. Error bars represent SEM.
