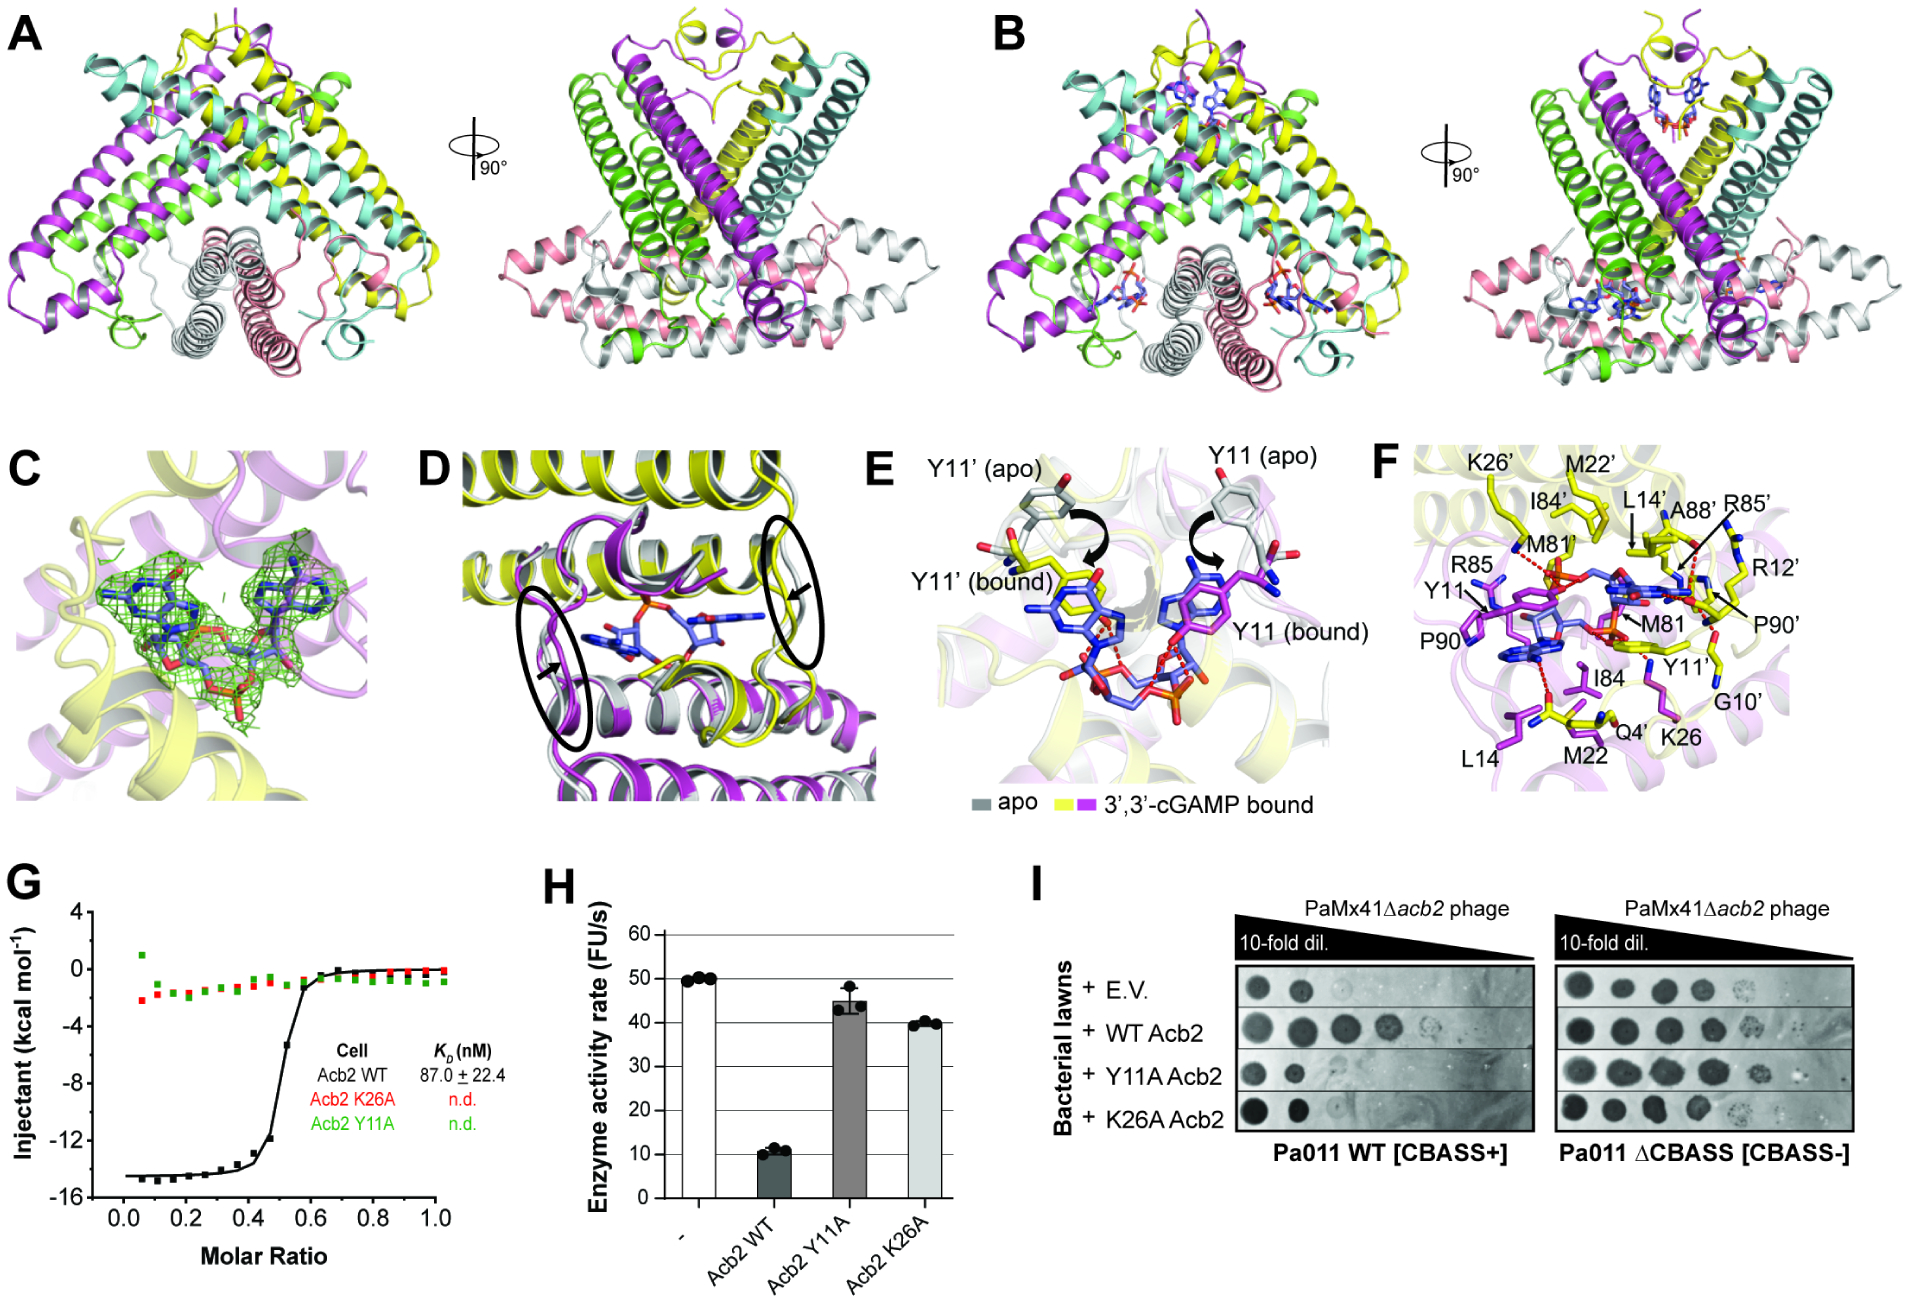
Figure 4. Structure of Acb2 reveals hexamer bound to three molecules of 3’,3’-cGAMP.

(A) Overall structure of the Acb2 hexamer. Two views are shown. (B) Overall structure of the Acb2 hexamer bound to three molecules of 3’,3’-cGAMP. 3’,3’-cGAMP molecules are colored in slate. (C) 2Fo-Fc electron density of 3’,3’-cGAMP in the binding pocket contoured at 1 σ. (D) Structural comparison between an Acb2 dimer in its apo (colored in gray) and 3’,3’-cGAMP-bound form (colored in yellow and light magenta). The loops which move upon 3’,3’-cGAMP binding are marked with black circles. (E) Structural alignment between apo and 3’,3’-cGAMP-bound Acb2, which are colored as in (B). Y11 from the two structures are highlighted as sticks. Red dashed lines represent poplar interactions. (F) Binding between Acb2 or Acb2 mutants and 3’,3’-cGAMP. Red dashed lines represent polar interactions. (G) ITC assays to test the binding of 3’,3’-cGAMP to Acb2 mutants. Representative binding curves and binding affinities are shown. The KD values are mean ± s.d. (n=3). Raw data for these curves are shown in Figure S4. (H) CapV activity assay to test the effects of Acb2 mutations. The concentration of 3’,3’-cGAMP was 0.8 μM and Acb2 or its mutants was 32 μM. The 3’,3’-cGAMP was pre-incubated with Acb2 or its mutants for 10 minutes. Bar graph represents average of three technical replicates. Data are mean ± s.d. (n=3). (I) Plaque assays on a lawn of Pa011 WT or ΔCBASS overexpressing empty vector (E.V.) or the indicated PaMx41 Acb2 mutants; clearings represent phage replication.
