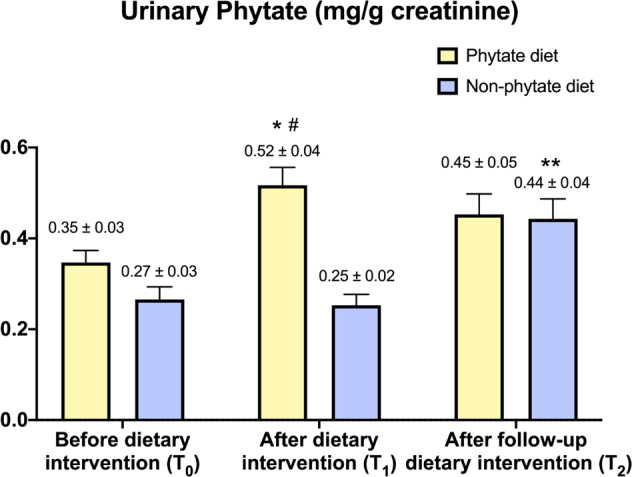
Fig. 3. Effect of phytate diet on urinary levels of InsPs.

Values are expressed as means and SEM. Intragroup differences (T0 vs. T1, T1 vs. T2) were assessed using a paired-sample Wilcoxon signed-rank test (*P value <0.05 for T0 vs. T1, **P value for T2 vs. T1 & T2 vs.T0). Intergroup differences (phytate diet vs. non-phytate diet) were assessed using Mann–Whitney U test for the before-dietary intervention group, and analysis of covariance after adjusting for baseline levels (#). Benjamini–Hochberg procedure was used to correct for the false discovery rate.
