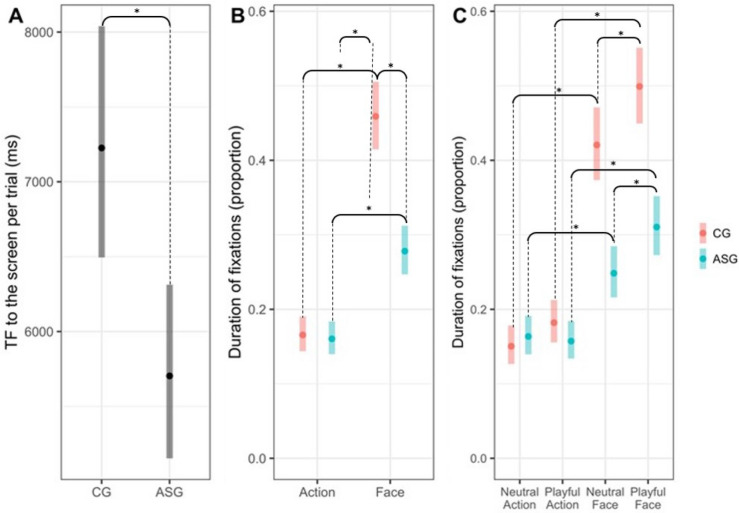
Figure 1.
Results from the generalised linear mixed effect models (*= p < 0.05). Panel (A) shows the Total Fixations Duration (TF) per trial in CG and ASG estimated through a negative binomial mixed effect model. Panel (B) represents the proportion of fixations duration (P-FD) to the areas of interest (face, actions) in CG and ASG. Panel (C) represents the P-FD to the areas of interest across conditions (playful and neutral) in CG and ASG. Both results in panel B and C were obtained from a beta mixed effect regression model. Bars represent the 95% confidence intervals estimated by the regression models.

