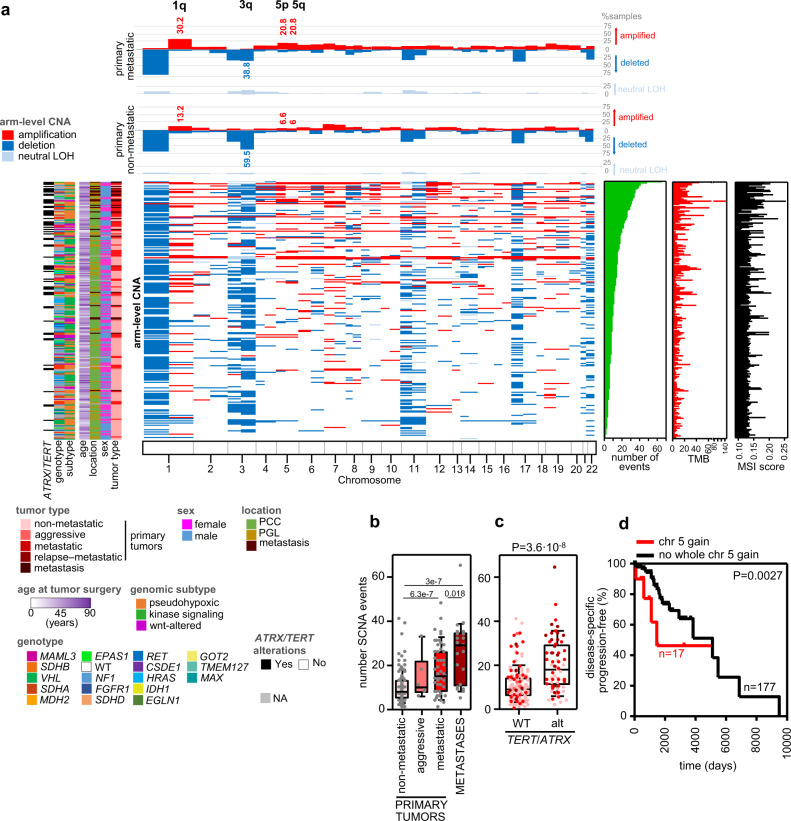
Fig. 3. Somatic copy number alterations (SCNA) profile in mPPGLs.
The data included is from 234 tumor-normal pairs from the CNIO and TCGA cohorts. a Overview of the arm-level SCNA, and clinical, molecular and technical features of the whole series. Tumors have been ranked by SCNA burden (number of SCNA events). The legend in the bottom indicates the color code for each item. Top panel: % of samples with arm-level CNA in metastatic and non-metastatic primary tumors. Significant (Fisher test; FDR < 0.1) regions between both groups are annotated. b SCNA burden (number of SCNA events) across PPGLs (n = 232). P values shown were calculated with a two-sided MWW test. c SCNA in ATRX/TERT-wild-type (WT) and in ATRX/TERT-altered tumors (n = 232). Two-sided MWW was used to test for differences. d Progression-free survival analysis of patients according to the presence of whole chromosome 5 gains (n = 17) or no whole chromosome gains (n = 177) in primary tumors. Only primary tumors from non-metastatic and metastatic patients included. Kaplan-Meier plot of time to progression (time between the first PPGL diagnosis and the first documented metastasis) and the P-value calculated using a log-rank test is exposed. Patients without evidence of metastases were censored at the date of the last follow-up. For all box-plots in this figure: the median value is marked, and Tukey whiskers are represented. See also Supplementary Fig. 4. Source data are provided as a Source Data file.

