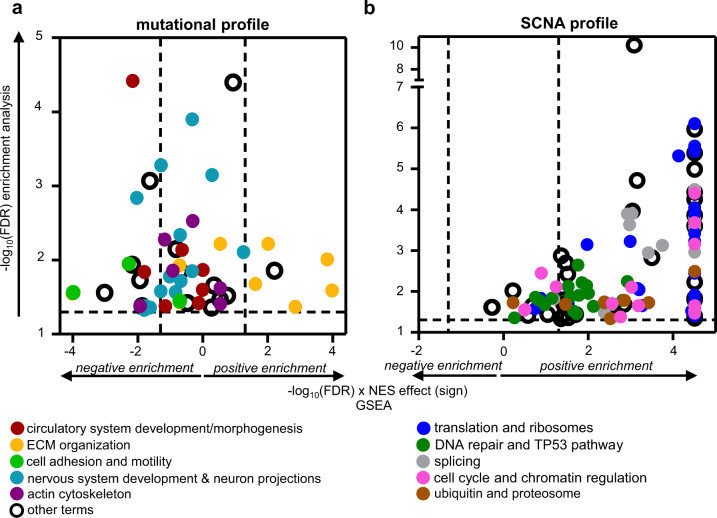
Fig. 5. Functional enrichment analysis of mutated (a) and CN-altered (b) genes in mPPGLs.
Functional enrichment analysis of mutated (a) and CN-altered (b) genes in mPPGLs. y-axis indicates the −log10(FDR) of each gene set identified in the functional enrichment analysis performed using the list of 323 genes mutated in the metastatic primary tumors (a) or the 911 genes with differing SCNA between metastatic and non-metastatic primary tumors (b). Only those gene sets with fold-change enrichment (FCe) > 1.8 and FDR < 0.05 by Fisher’s Exact test were considered. x-axis indicates −log10(FDR) × NES sign from the GSEA analysis performed using the gene sets recognized in the functional enrichment analysis and the RNA-Seq series of metastatic versus non-metastatic primary tumors. The gene sets related to each functional annotation are shown in different colors as depicted in the legend. Dashed lines indicate the cut-off values for significance. The extended version of the figure, in which each gene set name is annotated, is depicted in Supplementary Figs. 8, 9. Source data are provided as a Source Data file.

