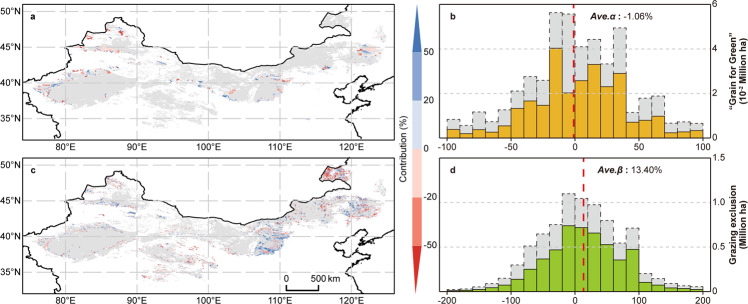
Fig. 1. The contributions of desertification-combating practices to vegetation restoration.
Spatial and statistical distributions of the contributions (%) of “grain-for-green” a, b and grazing exclusion c, d practices to vegetation restoration since 2000 and 2003, respectively. The x-axis in b, d corresponds to the contributions in a, c. The scope of the desertification-prone region is marked in panels a and c with gray. For each pixel in a, c, the average fractional vegetation cover (FVC) trend resulting from climate change and CO2 fertilization (natural FVC trends) is derived by satellite and multiple linear regression simulations, while the contributions of intervention practices are estimated based on the average difference between the natural FVC trend and the actual trend involving practices implementation. Ave.α and Ave.β in b, d are the integrated contributions of the “grain-for-green” and grazing exclusion practices, respectively. These values are calculated based on area-weighted statistics of the pixel-level contributions in a and c as follows: Ave.α (or β) = Σ [α (or β)i·areai]/Σareai, where α (β)i is the vegetation restoration contribution of the two practices in i-th pixel involved, and areai is the area of the i-th pixel. Noted that only regions with significant trends (passed the Mann-Kendall test at the 95% significance level) were considered in area-weighted statistics and rest were shown by the dotted box filled with gray in b, d. See Methods for more details about the identification of pixels involved in the “grain-for-green” and grazing exclusion practices, and about the calculation of pixel-level contributions.

