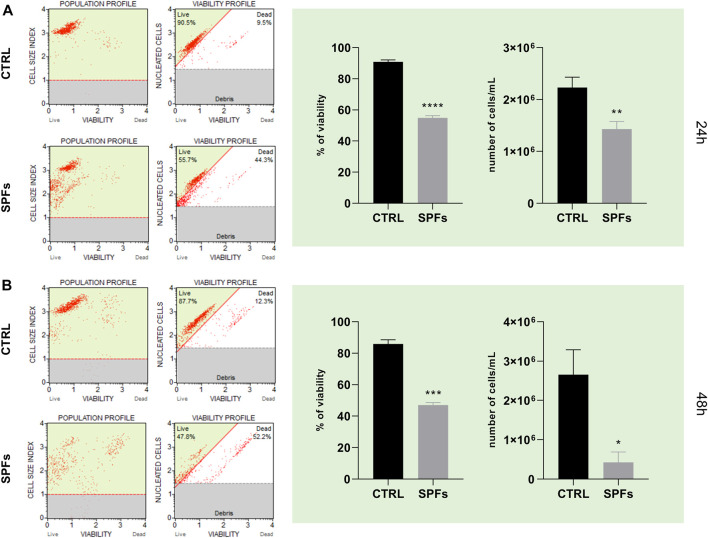
FIGURE 2.
SPF affects cancer cell count and viability. (A) Cell population and viability profiles (from left to right) for CTRL and SPFs (from the top to bottom) after 24 h—histograms of percentage of viability and number of cells/mL of suspension after 24 h. (B) Cell population and viability profiles (from left to right) for CTRL and SPFs (from the top to bottom) after 48 h—histograms of percentage of viability and number of cells/mL of suspension after 48 h. Data are expressed as the means ± SD of three experiments performed in triplicate (*p < 0.05 versus CTRL).

