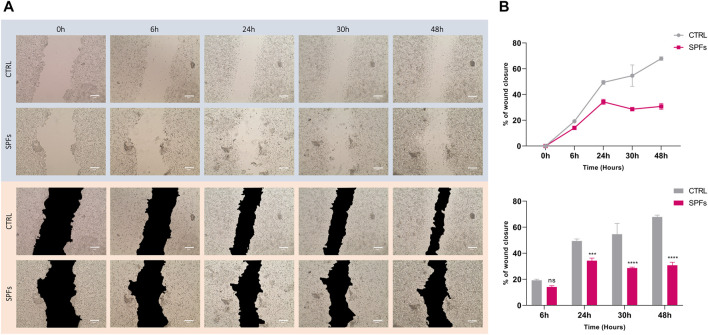
FIGURE 3.
Inhibiting effects of SPFs on cancer cell migration. (A) Representative photos of wound healing assay with or without SPFs. Photos were taken from time 0–48 h (columns from left to right). All images were acquired using a Leica microscope with a magnification of ×20. The scale bar represents 200 µm. (B) Quantification of wound closure percentage expressed as a line graph (top) and bar chart (bottom). Data are expressed as the means ± SD of three experiments performed in triplicate (*p < 0.05 versus CTRL).

