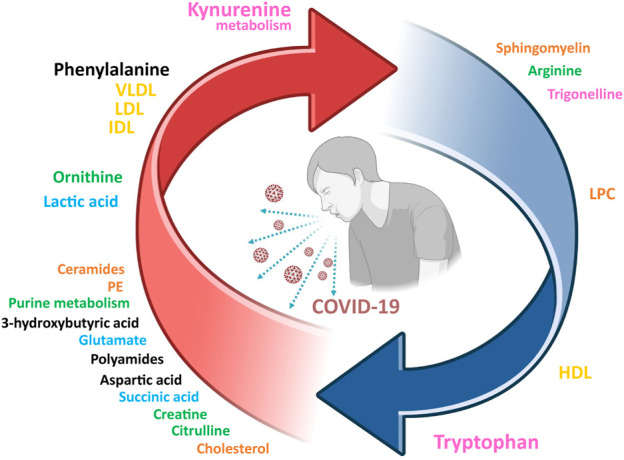
FIGURE 1.

A consensus view of the metabolic signature of COVID-19 patients. Arrow colors indicate if metabolites are upregulated (red) or downregulated (blue). The letter size is proportional to the supporting experimental evidence. Color legend for the metabolic pathways: tryptophan metabolism (pink), central metabolism (blue), purine metabolism and urea cycle (green), lipids (orange), lipoproteins (yellow), other (black). VLDL, very low-density lipoproteins; LDL, low density lipoproteins; HDL, high density lipoproteins; IDL, intermediate density lipoproteins; PE, phosphatidylethanolamine.
