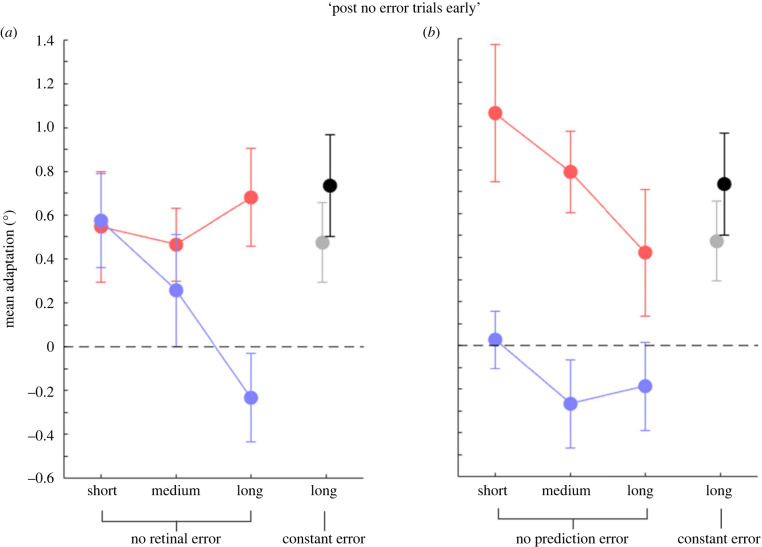
Figure 4.
Mean saccade and localization adaptation (°) for ‘post no error trials early’ in the three conditions tested. (a) Mean saccade (red dots) adaptation and visual localization (blue dots) in the ‘no retinal error’ trials experiment (experiment 1). (b) The same convention as in (a), for trials in the ‘no prediction error’ experiment (experiment 2). Grey and black circles represent the mean saccade adaptation and visual localization, respectively. Error bars are standard errors of the mean. The dotted line indicates a null effect of adaptation.

