. 2023 Jan 12;11(3):306–319. doi: 10.1158/2326-6066.CIR-22-0454

Figure 2.

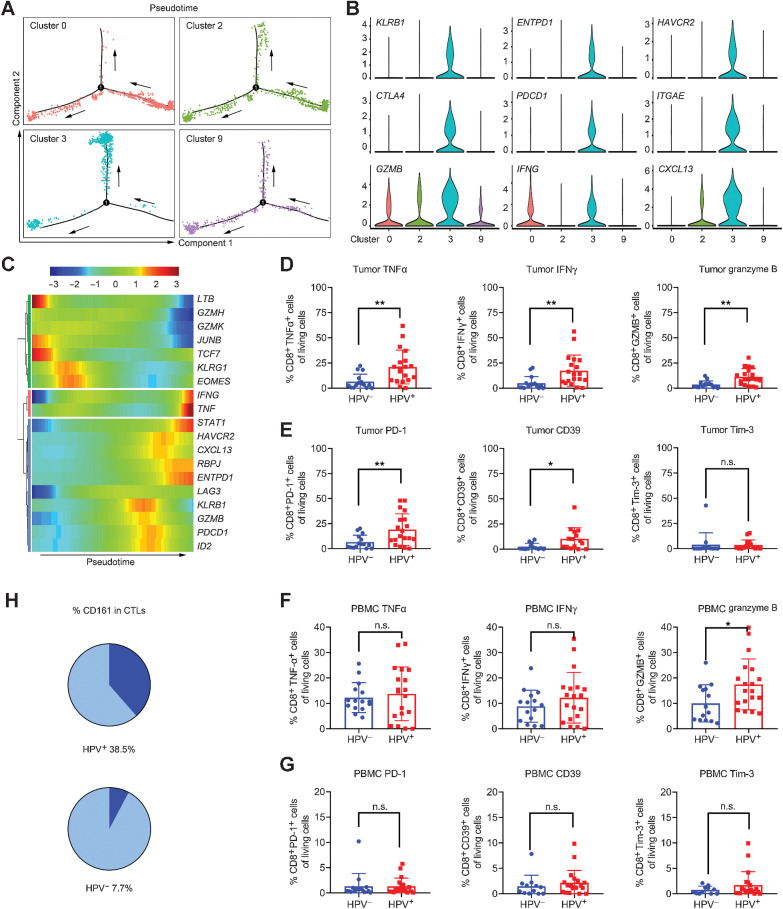
Figure 2. The heterogeneity and cytotoxicity of CTLs in HPV-positive OPSCC. A, Trajectory analysis for the CD8+ T-cell clusters (clusters 0, 2, 3, and 9). B, Expression of marker genes in CD8+ T cells annotated and marked by color code. C, Pseudotime analysis of marker genes in CD8+ T cells. D, Expression of cytotoxic cytokines in OPSCC biopsies (HPV−, n = 14–15; HPV+, n = 19) via flow cytometry, unpaired Student t test. E, Expression of inhibitory receptors in OPSCC biopsies (HPV−, n = 13–15; HPV+, n = 15–19) via flow cytometry, unpaired Student t test. F, Expression of cytotoxic cytokines in PBMCs (HPV−, n = 12–15; HPV+, n = 19–20) via flow cytometry, unpaired Student t test. G, Expression of inhibitory receptors in PBMCs (HPV−, n = 14–15; HPV+, n = 19) via flow cytometry, unpaired Student t test. H, The proportion of CD161+ CTLs (dark blue) based on the data from single-cell RNA sequencing. *, sP < 0.05 and **, P < 0.01. n.s.: no statistical significance.

The heterogeneity and cytotoxicity of CTLs in HPV-positive OPSCC. A, Trajectory analysis for the CD8+ T-cell clusters (clusters 0, 2, 3, and 9). B, Expression of marker genes in CD8+ T cells annotated and marked by color code. C, Pseudotime analysis of marker genes in CD8+ T cells. D, Expression of cytotoxic cytokines in OPSCC biopsies (HPV, n = 14–15; HPV+, n = 19) via flow cytometry, unpaired Student t test. E, Expression of inhibitory receptors in OPSCC biopsies (HPV, n = 13–15; HPV+, n = 15–19) via flow cytometry, unpaired Student t test. F, Expression of cytotoxic cytokines in PBMCs (HPV, n = 12–15; HPV+, n = 19–20) via flow cytometry, unpaired Student t test. G, Expression of inhibitory receptors in PBMCs (HPV, n = 14–15; HPV+, n = 19) via flow cytometry, unpaired Student t test. H, The proportion of CD161+ CTLs (dark blue) based on the data from single-cell RNA sequencing. *, P < 0.05 and **, P < 0.01. n.s.: no statistical significance.