. 2023 Jan 12;11(3):306–319. doi: 10.1158/2326-6066.CIR-22-0454

Figure 6.

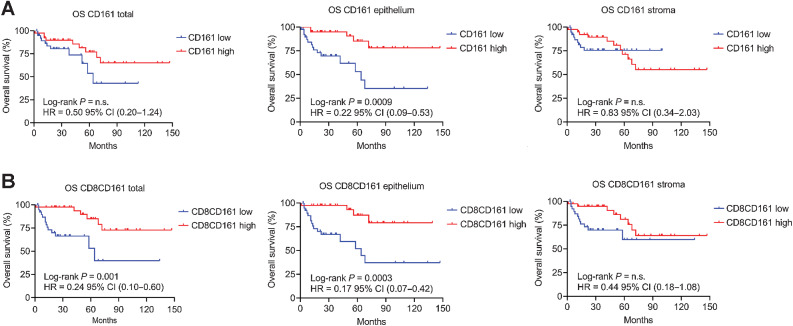
Figure 6. The prognostic significance of CD161+ CTLs in OPSCC. A, Kaplan–Meier survival plots showing the OS of the validation cohort between CD161 low (n = 39) and CD161 high (n = 39) according to the median cell density of CD161 (total 47 cells/mm2, intraepithelial 19 cells/mm2, stromal 23 cells/mm2) or (B) Kaplan–Meier survival plots between CD8+CD161+ low (n = 39) and CD8+CD161+ high (n = 39) according to the median cell density of CTLs with coexpression of CD8 and CD161 (total 16 cells/mm2, intraepithelial 5.5 cells/mm2 or stromal 8 cells/mm2). The HR with 95% CI and log-rank P value are given. n.s.: no statistical significance.

The prognostic significance of CD161+ CTLs in OPSCC. A, Kaplan–Meier survival plots showing the OS of the validation cohort between CD161 low (n = 39) and CD161 high (n = 39) according to the median cell density of CD161 (total 47 cells/mm2, intraepithelial 19 cells/mm2, stromal 23 cells/mm2) or (B) Kaplan–Meier survival plots between CD8+CD161+ low (n = 39) and CD8+CD161+ high (n = 39) according to the median cell density of CTLs with coexpression of CD8 and CD161 (total 16 cells/mm2, intraepithelial 5.5 cells/mm2 or stromal 8 cells/mm2). The HR with 95% CI and log-rank P value are given. n.s.: no statistical significance.