. 2022 Nov 29;21(3):274–289. doi: 10.1158/1541-7786.MCR-22-0772

Figure 3.

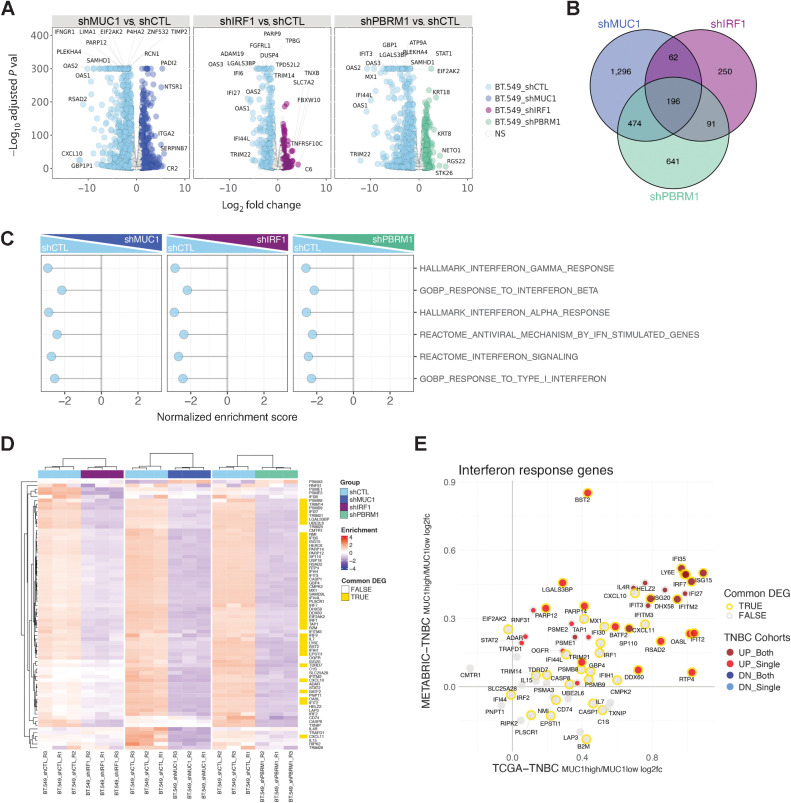
Figure 3. MUC1, PBRM1, and IRF1 regulate similar gene sets that are shared with TNBC tumors. A, RNA-seq was performed in triplicate on BT-549 cells silenced for MUC1, PBRM1, and IRF1. The datasets were analyzed for effects of MUC1-C silencing on repressed and activated genes as depicted by the Volcano plots. B, Venn diagram depicting the overlap of 196 downregulated genes in BT-549 cells silenced for MUC1, IRF1, and PBRM1(Supplementary Table S3). C, RNA-seq datasets from BT-549 cells silenced for MUC1, IRF1, and PBRM1 were analyzed with GSEA for enrichment distribution using the indicated IFN-related gene signatures. D, Heatmaps of 72 common genes between the HALLMARK INTERFERON GAMMA RESPONSE and HALLMARK INTERFERON ALPHA RESPONSE signatures in BT-549 cells silenced for MUC1, IRF1, and PBRM1. The row indicator shows the 45 common genes from the 196 DEGs identified in B (yellow, Supplementary Table S4). E, Common up- and downregulated IFN response genes (detectable 66 genes out of 72 genes) in MUC1-high versus MUC1-low TNBC tumors from the METABRIC and TCGA-BRCA datasets. The outline (gold/gray) represents common DEGs in BT549 cells identified in D. The red/gray/blue dot indicates significantly up/downregulated genes (MUC1high vs. MUC1low) in one or both of the TCGA-BRCA/METABRIC cohorts.

MUC1, PBRM1, and IRF1 regulate similar gene sets that are shared with TNBC tumors. A, RNA-seq was performed in triplicate on BT-549 cells silenced for MUC1, PBRM1, and IRF1. The datasets were analyzed for effects of MUC1-C silencing on repressed and activated genes as depicted by the Volcano plots. B, Venn diagram depicting the overlap of 196 downregulated genes in BT-549 cells silenced for MUC1, IRF1, and PBRM1 (Supplementary Table S3). C, RNA-seq datasets from BT-549 cells silenced for MUC1, IRF1, and PBRM1 were analyzed with GSEA for enrichment distribution using the indicated IFN-related gene signatures. D, Heatmaps of 72 common genes between the HALLMARK INTERFERON GAMMA RESPONSE and HALLMARK INTERFERON ALPHA RESPONSE signatures in BT-549 cells silenced for MUC1, IRF1, and PBRM1. The row indicator shows the 45 common genes from the 196 DEGs identified in B (yellow, Supplementary Table S4). E, Common up- and downregulated IFN response genes (detectable 66 genes out of 72 genes) in MUC1-high versus MUC1-low TNBC tumors from the METABRIC and TCGA-BRCA datasets. The outline (gold/gray) represents common DEGs in BT549 cells identified in D. The red/gray/blue dot indicates significantly up/downregulated genes (MUC1high vs. MUC1low) in one or both of the TCGA-BRCA/METABRIC cohorts.