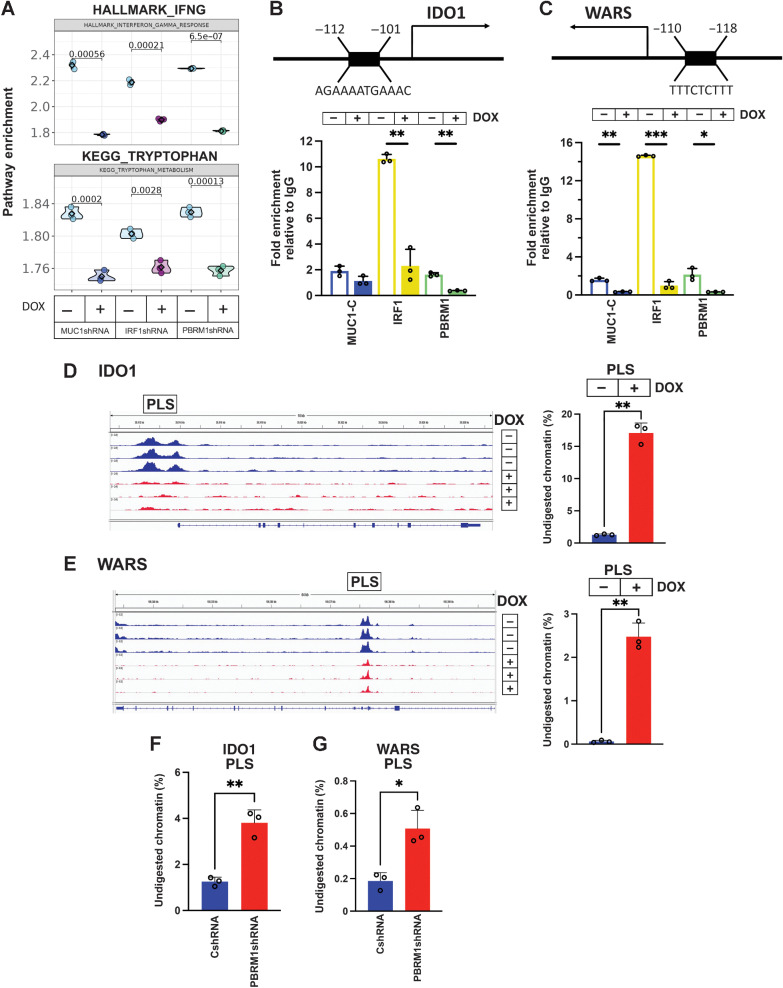
Figure 4.
MUC1-C/PBRM1/IRF1 complexes induce chromatin accessibility and expression of the IDO1 and WARS genes. A, Candidate pathway enrichment plot for the IFNG response and tryptophan metabolism in BT-549 cells silenced for MUC1-C, IRF1, and PBRM1. B, Schema of the IDO1 gene with localization of a PLS upstream to the TSS. Soluble chromatin from BT-549/tet-MUC1shRNA cells treated with vehicle or DOX for 7 days was precipitated with a control IgG, anti-MUC1-C, anti-IRF1, and anti-PBRM1. The DNA samples were amplified by qPCR with primers for the IDO1 PLS region. The results (mean ± SD and individual values) are expressed as relative fold enrichment as compared with that obtained with IgG (assigned a value of 1). C, Schema of the WARS gene with localization of a PLS upstream to the TSS. Soluble chromatin from BT-549/tet-MUC1shRNA cells treated with vehicle or DOX for 7 days was precipitated with a control IgG, anti–MUC1-C, anti-IRF1, and anti-PBRM1. The DNA samples were amplified by qPCR with primers for the WARS PLS region. The results (mean ± SD and individual values) are expressed as relative fold enrichment as compared with that obtained with IgG (assigned a value of 1). D and E, Genome browser snapshots of ATAC-seq data from the IDO1 (D) and WARS (E) PLS regions in BT-549/tet-MUC1shRNA cells treated with vehicle or DOX for 7 days (left). Chromatin was analyzed for accessibility by nuclease digestion (right). The results are expressed as the percentage of undigested chromatin (mean ± SD and individual values). F and G, Chromatin from BT-549/CshRNA and BT-549/PBRM1shRNA cells was analyzed for accessibility of the IDO1 (F) and WARS (G) PLS regions by nuclease digestion. The results are expressed as the percentage of undigested chromatin (mean±SD and individual values). *, P ≤ 0.05; **, P ≤ 0.01; ***, P ≤ 0.001.

