. 2022 Nov 29;21(3):274–289. doi: 10.1158/1541-7786.MCR-22-0772

Figure 7.

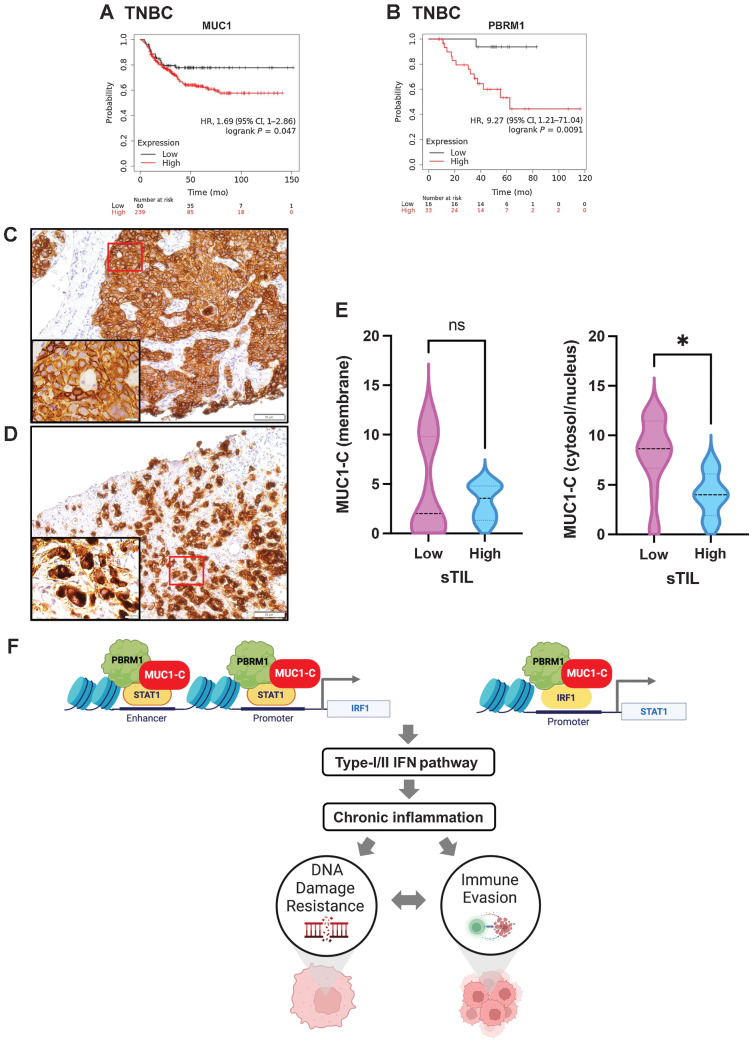
Figure 7. MUC1 and PBRM1 associate with decreases in responsiveness of TNBC tumors to chemotherapy. A and B, Kaplan–Meier curves for relapse-free survival created by the public database and web application KM plotter (http://kmplot.com/analysis/) based on the MUC1 (A) and PBRM1 (B) expression levels. Patients with TNBC were stratified with high (red) or low (black) expression of MUC1 and PBRM1. C and D, Representative MUC1-C staining in cell membrane (C) and cytosol/nuclear (D) of primary TNBC samples (magnifications, ×20). Insets highlight localization of MUC1-C expression in cancer cells (magnifications, ×100). E, TNBC tumors with cell membrane (left) and cytosol/nuclear (right) MUC1-C expression were stratified with sTIL levels in TNBC samples. F, Proposed model based on the present data demonstrating that MUC1-C induces PBRM1 expression and, in turn, binds to PBRM1. MUC1-C/PBRM1 complexes associate with (i) STAT1 in activating the IRF1 gene and (ii) IRF1 in activating STAT1 by increasing chromatin accessibility and their transcription. Induction of STAT1 and IRF1 expression contributes to a feed-forward circuit in which MUC1-C/PBRM1/STAT1 and MUC1-C/PBRM1/IRF1 complexes drive activation of genes in the type I and II IFN pathways. In this way, prolonged MUC1-C activation in settings of repetitive cycles of damage and repair promote chronic inflammation. A consequence of persistent MUC1-C activation and PBRM1-mediated chromatin remodeling is the establishment of IFN gene signatures that contribute to the CSC state and DNA damage resistance. DNA damage-induced inflammatory signaling is coupled to immune evasion, which in turn contributes to a MUC1-C/PBRM1-driven auto-inductive circuit that integrates a refractory state to treatment with genotoxic and immunotherapeutic agents. Figure created with BioRender.com.

MUC1 and PBRM1 associate with decreases in responsiveness of TNBC tumors to chemotherapy. A and B, Kaplan–Meier curves for relapse-free survival created by the public database and web application KM plotter (http://kmplot.com/ analysis/) based on the MUC1 (A) and PBRM1 (B) expression levels. Patients with TNBC were stratified with high (red) or low (black) expression of MUC1 and PBRM1. C and D, Representative MUC1-C staining in cell membrane (C) and cytosol/nuclear (D) of primary TNBC samples (magnifications, ×20). Insets highlight localization of MUC1-C expression in cancer cells (magnifications, ×100). E, TNBC tumors with cell membrane (left) and cytosol/nuclear (right) MUC1-C expression were stratified with sTIL levels in TNBC samples. F, Proposed model based on the present data demonstrating that MUC1-C induces PBRM1 expression and, in turn, binds to PBRM1. MUC1-C/PBRM1 complexes associate with (i) STAT1 in activating the IRF1 gene and (ii) IRF1 in activating STAT1 by increasing chromatin accessibility and their transcription. Induction of STAT1 and IRF1 expression contributes to a feed-forward circuit in which MUC1-C/PBRM1/STAT1 and MUC1-C/PBRM1/IRF1 complexes drive activation of genes in the type I and II IFN pathways. In this way, prolonged MUC1-C activation in settings of repetitive cycles of damage and repair promote chronic inflammation. A consequence of persistent MUC1-C activation and PBRM1-mediated chromatin remodeling is the establishment of IFN gene signatures that contribute to the CSC state and DNA damage resistance. DNA damage-induced inflammatory signaling is coupled to immune evasion, which in turn contributes to a MUC1-C/PBRM1-driven auto-inductive circuit that integrates a refractory state to treatment with genotoxic and immunotherapeutic agents. Figure created with BioRender.com. *, P ≤ 0.05.