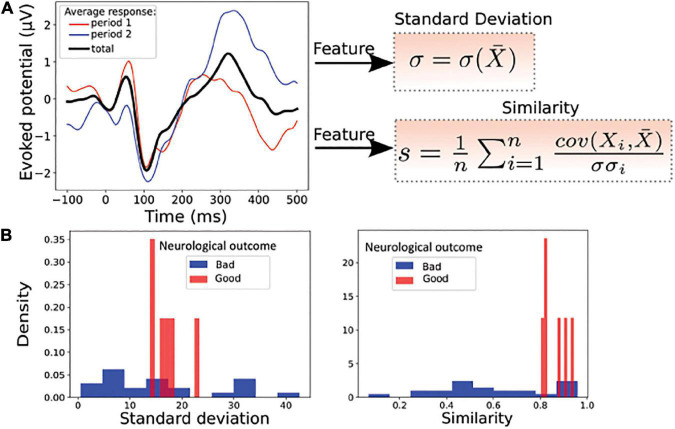
FIGURE 2.
Statistical features associated to standard responses. (A) Left: average evoked responses computed over a time window of [0−10]min (period 1, red), [10−20]min (period 2, blue) and over the entire period ([0−20]min, black). Right: the standard deviation σ and the average correlation function s(similarity), between the response over the entire period ([0−20]min) and over one of the n periods ([0−20]min or [10−20]min), here n = 2. (B) Example of features distribution of dataset from the Cz electrode: standard deviation (Left) and similarity (Right) computed over the entire period; red (good neurological outcome) and blue (bad neurological outcome). These two parameters taken separately are insufficient to properly discriminate the two groups of patients.

