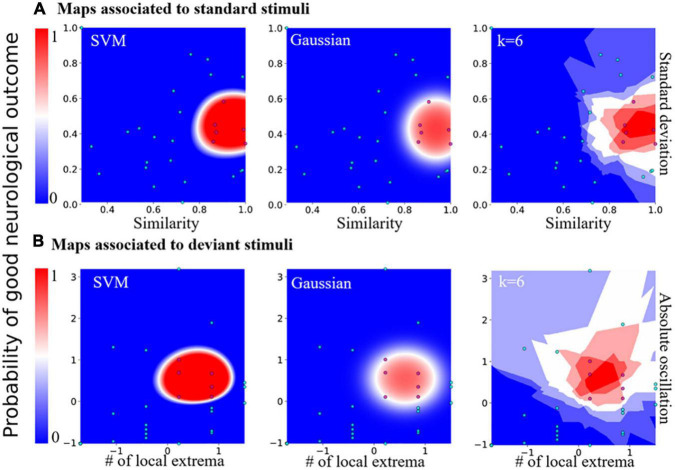
FIGURE 4.
Predictive probability maps of good neurological outcome. (A) Probability maps computed from features of the standard stimuli responses. From left to right: maps computed from SVM, Gaussian, and the k-nearest neighbors classifier (k = 6, the worst case scenario). (B) Probability maps computed from features of the deviant stimuli features. From left to right: maps computed from SVM, Gaussian, and the k-nearest neighbors classifier with distance-related weights, k = 6 for example.

