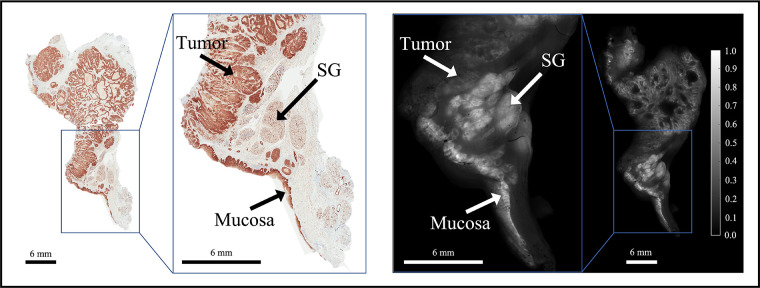
Figure 1.
Representative bread-loafed slice of a head and neck cancer displaying normal and tumor-derived EGFR expression. EGFR IHC staining (left) and fluorescence (right) images of slice #16 from dose group 2. Arrows annotate EGFR-positive tissues including tumor, salivary gland (SG), and mucosa on the EGFR IHC staining and fluorescence images, respectively.

