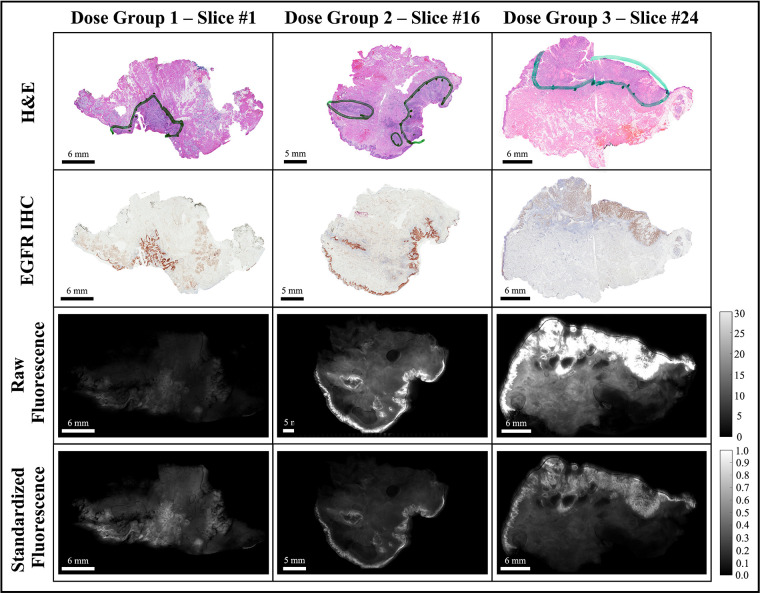
Figure 3.
Representative bread-loaf slices from the three dose groups (30, 90, and 171 nanomoles). Green contours in the H&E images indicate ground truth tumor regions delineated by an expert pathologist (L.J.T.). The bottom two rows show comparisons of fluorescence images before (raw fluorescence) and after image pre-processing (standardized fluorescence).

