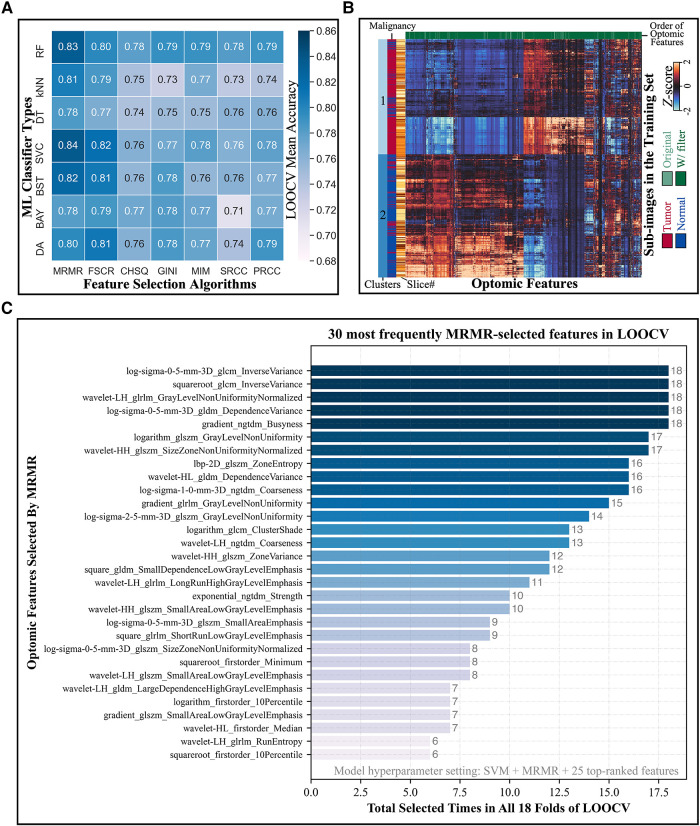
Figure 5.
Model hyperparameter optimization through LOOCV and feature selection. (A) Heatmap depicts the LOOCV mean accuracy achieved by different combinations of classifiers (rows) and feature selection algorithms (columns) when 25 top-ranked features were used. The combination of SVM classifier and MRMR feature selection showed the highest validation accuracy. (B) Hierarchical clustering of training set sub-image patches (5,470 total; vertical axis) and optomic features (1,472 total; horizontal axis) reveals natural groupings of tissue types. (C) Most frequently selected features by MRMR with the optimal hyperparameters combination during LOOCV. Horizontal axis represents the number of times that each optomic feature was selected by MRMR in all 18 folds of LOOCV.

