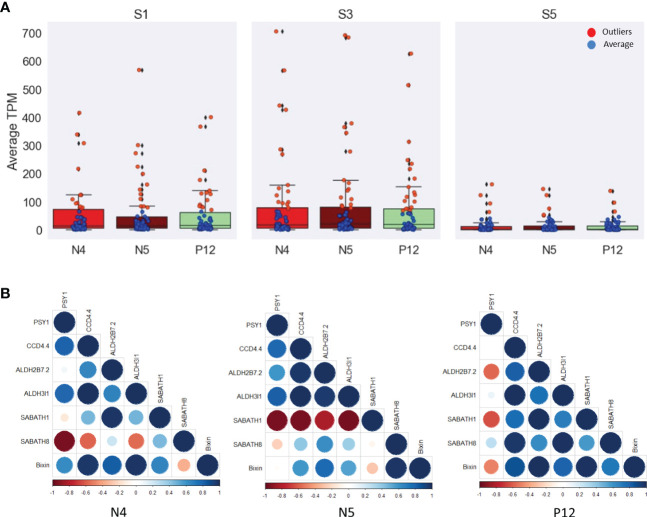
Figure 5.
TPM analysis of the 57 genes related to isoprene, terpene, carotene, and carotenoid pathways. (A) Box plots showing the average (blue) and outlier (red) genes during the seed development. S3 exhibits most of the outlier genes. (B) Heat maps showing the spearman correlation among the more highly correlated genes with the bixin in each B. orellana accession. The low correlated PSY1 gene was selected to show the differences in the correlation values. The head arrow indicates the bixin. Bo nomenclature from gene names was removed to simplify the images.

