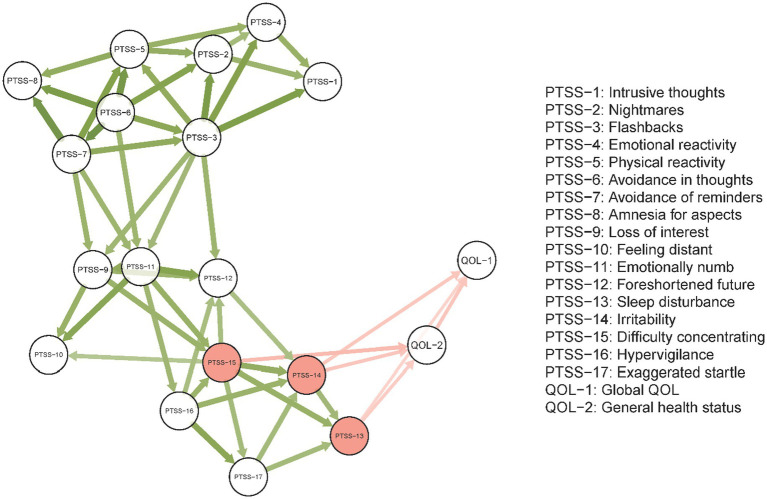
Figure 3.
Directed network model of the PCL-C and QOL estimated by the Triangulated Maximally Filtered Graph (TMFG) method. Edge thickness indicates edge weight. Red nodes have the highest bridge strength in the undirected network. Arrows indicate the direction of influence. Defining the two-way influences between node i and node j as D(i, j) and D(j, i), only the greater link between D(i, j) and D(j, i) is retained.

