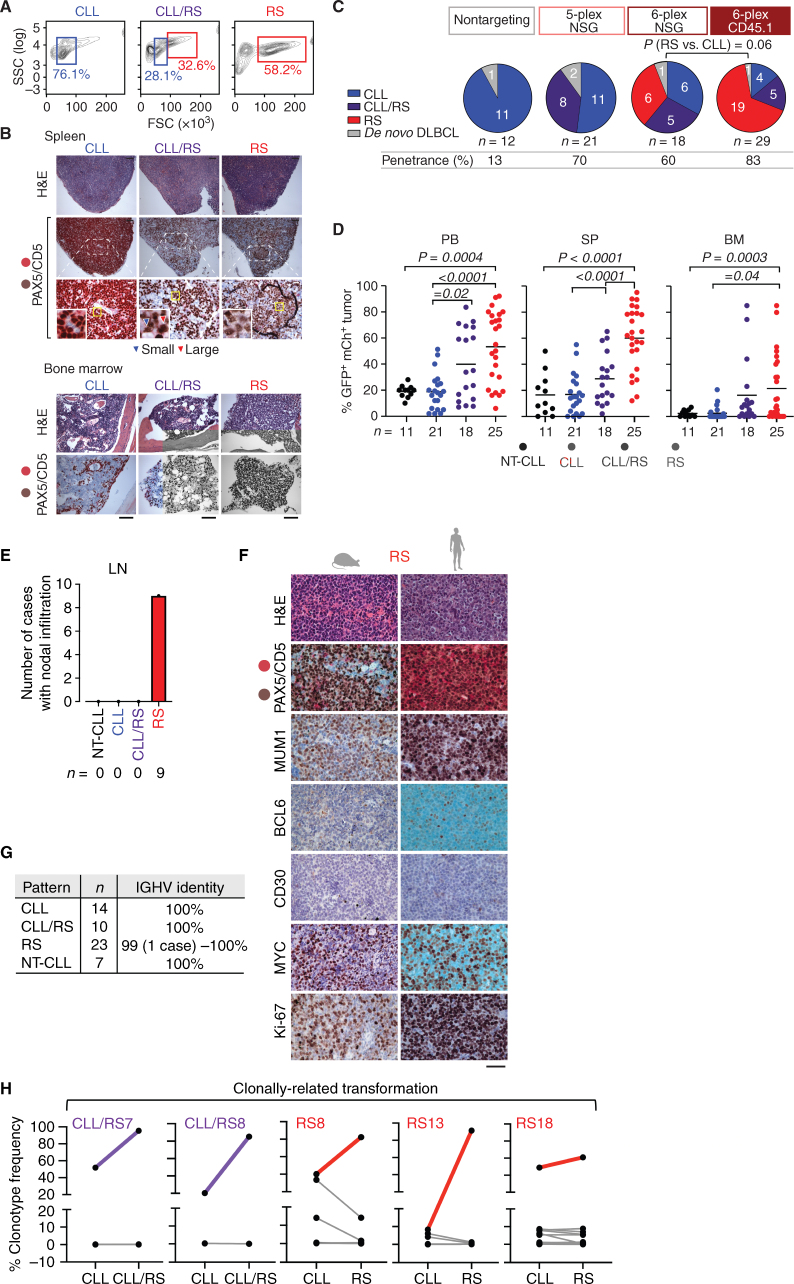
Figure 2.
Transformation into RS shows phenotypes consistent with human disease. A, Representative flow-cytometric plots highlighting the presence of small (CLL), small and large (CLL/RS), or large (RS) cells in the SP of one representative animal per disease pattern, at euthanasia. B, Representative H&E and CD5/PAX5 images from SP and BM of one case per group. Arrows indicate the presence of both small (blue) and large (red) cells in the representative CLL/RS case. Images captured at 10× magnification; black bar,100 μm; white bar, 20 μm. C, Pie charts displaying number of total cases of CLL (blue), CLL/RS (purple), and RS (red) in CD45.1, NSG 6-plex, NSG 5-plex and all nontargeting cohorts. Overall penetrance for each cohort is indicated. P, Fisher exact test. D, Disease burden as represented by %GFP+mCherry+B220+CD5+ Igκ+ cells in PB, SP, and BM of 11 NT-CLL, 21 CLL, 18 CLL/RS, and 25 RS cases at euthanasia. NT-CLL, nontargeting CLL controls. Horizontal lines, group median values. P values, ANOVA with Tukey correction for multiple comparisons. E, Number of cases displaying visible nodal infiltrations. LN, Lymph nodes. F, Representative IHC staining from one murine (left) and one human RS case (right) stained for CD5/PAX5, MUM1, BCL6, CD30, MYC, and Ki67. Images were taken at a 40× magnification; scale bar, 50 μm. G, Number of animals per pattern, and IGHV homology to germline, as assessed by BCR Immuno-Seq. H, Percent (%) clonotype frequency of shared BCR rearrangements as analyzed at time of CLL and upon RS transformation (euthanasia) in 2 CLL/RS and 3 RS cases sampled serially. The dominant RS clonotype is shown in purple (CLL/RS) and red (RS).

