. 2022 Dec 6;4(2):150–169. doi: 10.1158/2643-3230.BCD-22-0082

Figure 5.

Figure 5. Tonic PI3K signaling is a characteristic feature of RS. A, Immunoblot analysis of 12 murine RS and 14 human RS cases, assessed for baseline expression of c-MYC, PTEN, and phosphorylation and total expression of AKT and S6 kinases. GAPDH is shown as a loading control. Separate gels, run concomitantly, were used for the analysis. B, Heat map of relative phosphorylation intensities in AKT and S6, as analyzed by western blot in del(13q)-CLL (n = 5), CLL/RS (n = 6), RS (n = 12), and human RS (n = 14). P, ANOVA. C, Linear regression of c-MYC and PTEN protein expression levels (normalized to GAPDH) in 12 murine and 14 human RS cases. P, Pearson correlation. D, Representative IGV tracks of Chd2 ChIP-seq and RNA-seq data of the Ptpn6 gene region from one representative normal B, one del(13q)-CLL, one Chd2-wt RS, and one clonal Chd2-mut RS case. E, Western blot analysis of SHP1 levels in primary murine RS carrying either wild-type (WT) or clonal Chd2 mutation (MUT). GAPDH is displayed, as control. F, Relative SHP1 expression (normalized to GAPDH) in 5 murine RS carrying subclonal/wt Chd2, and 5 cases carrying clonal Chd2 lesions. Mean with SEM is displayed. P, Mann–Whitney. G, Annotation of UMAP representation of single-cell chromatin accessibility profiles by cell type of murine data (left). B cells (black), CLL (blue), and RS (red) cells, T cells (brown), myeloid (gray), and erythroid (beige) compartment and deviation scores of TCF3 transcription factor motifs in murine data sets (right). H, Distribution of deviation z-scores of murine TCF3 binding motif across T cells, B cells, CLL, and RS. Median and interquartile ranges are displayed. P, ANOVA with Tukey correction for multiple comparisons. I, Annotation of UMAP representation of human single-cell chromatin accessibility profiles by cell type (left). B cells (black), CLL (blue), RS (lymph node: red, BM and PB: dark pink) cells, T cells (brown), and deviation scores of TCF3 transcription factor motifs (right). J, Distribution of deviation z-scores of human TCF3 binding motif across T cells, B cells, CLL, and RS. Median and interquartile ranges are displayed. P, paired t test. K, PI3K signature gene expression in the 4 normal B, 5 del(13q)-CLL, 4 CLL/RS, and 11 RS murine cases (mean with SEM) and in the 5 paired CLL/RS samples, analyzed by RNA-seq. P (murine), ANOVA; P (human), paired t test. L, Correlation between PI3K scores and MYC scores in the 4 CLL/RS and 11 RS murine cases and 37 human RS analyzed by RNA-seq. P value, Pearson correlation.

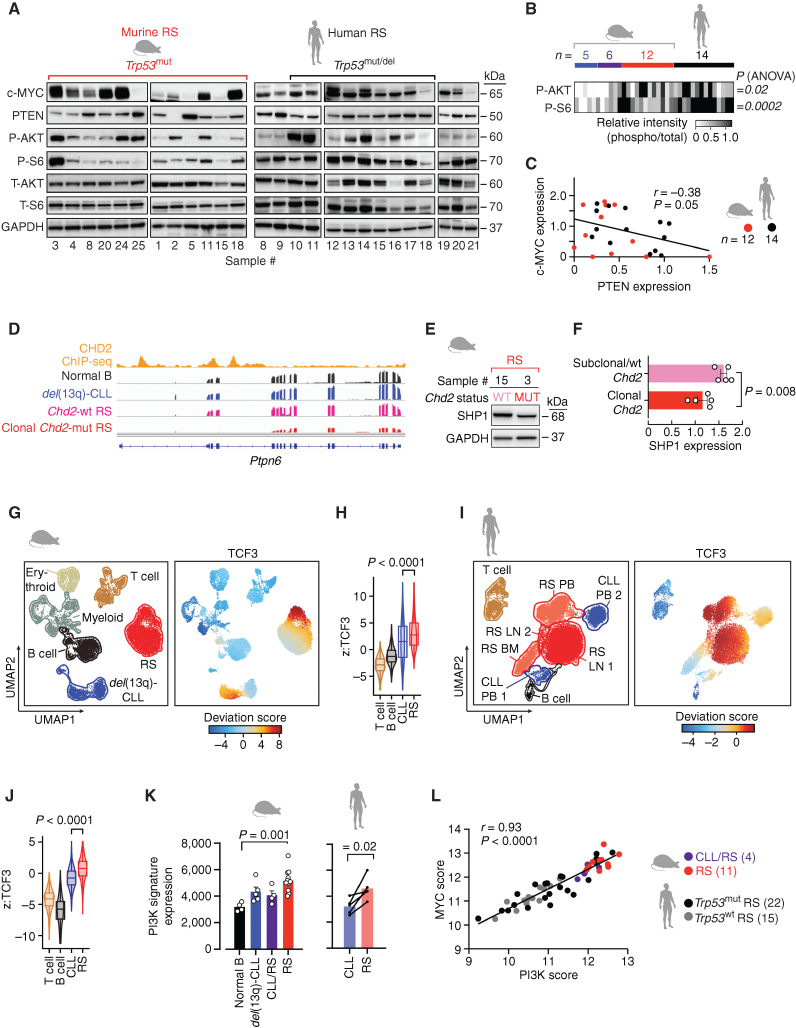
Tonic PI3K signaling is a characteristic feature of RS. A, Immunoblot analysis of 12 murine RS and 14 human RS cases, assessed for baseline expression of c-MYC, PTEN, and phosphorylation and total expression of AKT and S6 kinases. GAPDH is shown as a loading control. Separate gels, run concomitantly, were used for the analysis. B, Heat map of relative phosphorylation intensities in AKT and S6, as analyzed by Western blot in del(13q)-CLL (n = 5), CLL/RS (n = 6), RS (n = 12), and human RS (n = 14). P, ANOVA. C, Linear regression of c-MYC and PTEN protein expression levels (normalized to GAPDH) in 12 murine and 14 human RS cases. P, Pearson correlation. D, Representative IGV tracks of Chd2 ChIP-seq and RNA-seq data of the Ptpn6 gene region from one representative normal B, one del(13q)-CLL, one Chd2-wt RS, and one clonal Chd2-mut RS case. E, Western blot analysis of SHP1 levels in primary murine RS carrying either wild-type (WT) or clonal Chd2 mutation (MUT). GAPDH is displayed, as control. F, Relative SHP1 expression (normalized to GAPDH) in 5 murine RS carrying subclonal/wt Chd2, and 5 cases carrying clonal Chd2 lesions. Mean with SEM is displayed. P, Mann–Whitney. G, Annotation of Uniform Manifold Approximation and Projection (UMAP) representation of single-cell chromatin accessibility profiles by cell type of murine data (left). B cells (black), CLL (blue), and RS (red) cells, T cells (brown), myeloid (gray), and erythroid (beige) compartment and deviation scores of TCF3 transcription factor motifs in murine data sets (right). H, Distribution of deviation z-scores of murine TCF3 binding motif across T cells, B cells, CLL, and RS. Median and interquartile ranges are displayed. P, ANOVA with Tukey correction for multiple comparisons. I, Annotation of UMAP representation of human single-cell chromatin accessibility profiles by cell type (left). B cells (black), CLL (blue), RS (lymph node, red; BM and PB, dark pink) cells, T cells (brown), and deviation scores of TCF3 transcription factor motifs (right). J, Distribution of deviation z-scores of human TCF3 binding motif across T cells, B cells, CLL, and RS. Median and interquartile ranges are displayed. P, paired t test. K, PI3K signature gene expression in the 4 normal B, 5 del(13q)-CLL, 4 CLL/RS, and 11 RS murine cases (mean with SEM) and in the 5 paired CLL/RS samples, analyzed by RNA-seq. P (murine), ANOVA; P (human), paired t test. L, Correlation between PI3K scores and MYC scores in the 4 CLL/RS and 11 RS murine cases and 37 human RS analyzed by RNA-seq. P value, Pearson correlation.