. 2022 Dec 12;4(2):106–117. doi: 10.1158/2643-3230.BCD-22-0173

Figure 2.

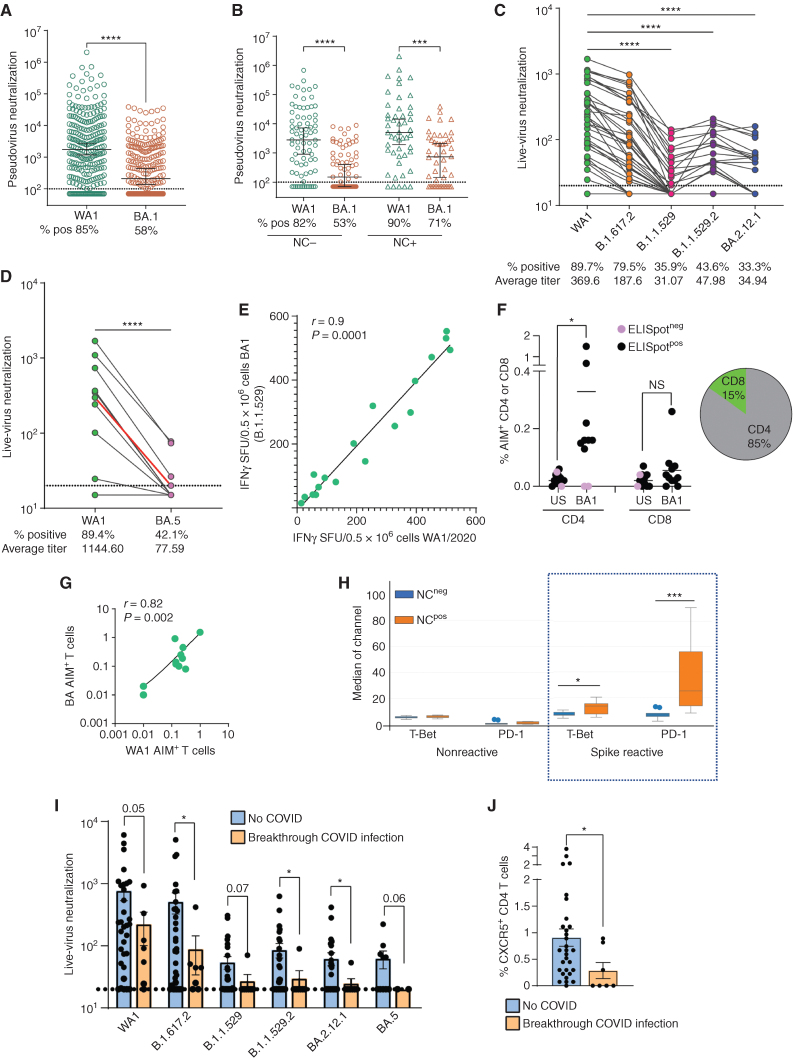
Figure 2. Variant-specific nAb/T cells and immunophenotypic correlates of immunity following 3 doses of SARS-CoV-2 vaccine. A, Pseudovirus neutralization IC50 against WA1 (n = 253) and Omicron (BA1: n = 249) variant. The figure shows the median with a 95% confidence interval (****, P < 0.0001, Mann–Whitney). Dotted lines show the threshold for detection at 100. B, Pseudovirus neutralization IC50 against WA1 and BA1, split by nucleocapsid reactivity (NC-WA: n = 78, NC-BA: n = 75, NC + WA: n = 49 and NC + BA: n = 48). Data, median with a 95% confidence interval (***, P < 0.001; ****, P < 0.0001 Kruskall Wallis). Dotted lines show the threshold for detection at 100. C, Live-virus neutralization (FRNT50) against ancestral strain (WA1), B.1.617.2, and Omicron variants (BA1 (B.1.1.529), BA2 (B.1.1.529.2), and BA2.12.1; n = 39). Lines connect data points from the same sample. Dotted line represents the lower limit of positive live-virus neutralization (<20; ****, P < 0.0001, Kruskal–Wallis). D, Live-virus neutralization (FRNT50) against ancestral strain (WA1) and BA.5 variant. The red line represents the median of all measurements. Lines connect datapoints from the same sample. The dotted line signifies a lower limit of positive neutralization (<20; ****, P < 0.0001 Mann–Whitney). E, Correlation between WA1 spike and BA1 spike reactivity as evaluated by interferon-gamma ELISpot. F, BA1-spike-reactive CD4+ and CD8+ T cells as assayed by AIM assay. Pie chart shows the mean proportions of BA1 spike-specific CD4+ and CD8+ T cells for all patients. US = unstimulated control (*, P < 0.05, paired t test). G, Correlation between WA spike- and BA spike-reactive AIM+ T cells. H, Phenotype of spike-reactive CD4+ T cells in NC+ or NC− patients, as analyzed by mass cytometry. Data, median expression of markers. ****, P < 0.0001, t test). I, Live-virus neutralization (FRNT50) against ancestral strain (WA1), and Omicron variants in patients with MM who developed breakthrough COVID infection, or did not, following booster mRNA vaccines. Data, mean + SEM. *, P < 0.05, t test with Welch correction). Values >0.05 are noted in the figure. J, Differences in the CXCR5+ T-cell cluster in patients with MM who developed breakthrough COVID infection, or did not, following booster mRNA vaccines. Figure shows mean + SEM. *, P < 0.05, t test with Welch correction).

Variant-specific nAb/T cells and immunophenotypic correlates of immunity following 3 doses of SARS-CoV-2 vaccine. A, Pseudovirus neutralization IC50 against WA1 (n = 253) and Omicron (BA1: n = 249) variant. The figure shows the median with a 95% confidence interval (****, P < 0.0001, Mann–Whitney). Dotted lines show the threshold for detection at 100. B, Pseudovirus neutralization IC50 against WA1 and BA1, split by nucleocapsid reactivity (NC-WA: n = 78, NC-BA: n = 75, NC + WA: n = 49 and NC + BA: n = 48). Data, median with a 95% confidence interval (***, P < 0.001; ****, P < 0.0001 Kruskall Wallis). Dotted lines show the threshold for detection at 100. C, Live-virus neutralization (FRNT50) against ancestral strain (WA1), B.1.617.2, and Omicron variants [BA1 (B.1.1.529), BA2 (B.1.1.529.2), and BA2.12.1; n = 39]. Lines connect data points from the same sample. Dotted line represents the lower limit of positive live-virus neutralization (<20; ****, P < 0.0001, Kruskal–Wallis). D, Live-virus neutralization (FRNT50) against ancestral strain (WA1) and BA.5 variant. The red line represents the median of all measurements. Lines connect datapoints from the same sample. The dotted line signifies a lower limit of positive neutralization (<20; ****, P < 0.0001 Mann–Whitney). E, Correlation between WA1 spike and BA1 spike reactivity as evaluated by interferon-gamma ELISpot. F, BA1-spike-reactive CD4+ and CD8+ T cells as assayed by AIM assay. Pie chart shows the mean proportions of BA1 spike-specific CD4+ and CD8+ T cells for all patients. US = unstimulated control. *, P < 0.05, paired t test. G, Correlation between WA spike- and BA spike-reactive AIM+ T cells. H, Phenotype of spike-reactive CD4+ T cells in NC+ or NC patients, as analyzed by mass cytometry. Data, median expression of markers. ****, P < 0.0001, t test. I, Live-virus neutralization (FRNT50) against ancestral strain (WA1), and Omicron variants in patients with MM who developed breakthrough COVID infection, or did not, following booster mRNA vaccines. Data, mean + SEM. *, P < 0.05, t test with Welch correction. Values >0.05 are noted in the figure. J, Differences in the CXCR5+ T-cell cluster in patients with MM who developed breakthrough COVID infection, or did not, following booster mRNA vaccines. Figure shows mean + SEM. *, P < 0.05, t test with Welch correction.