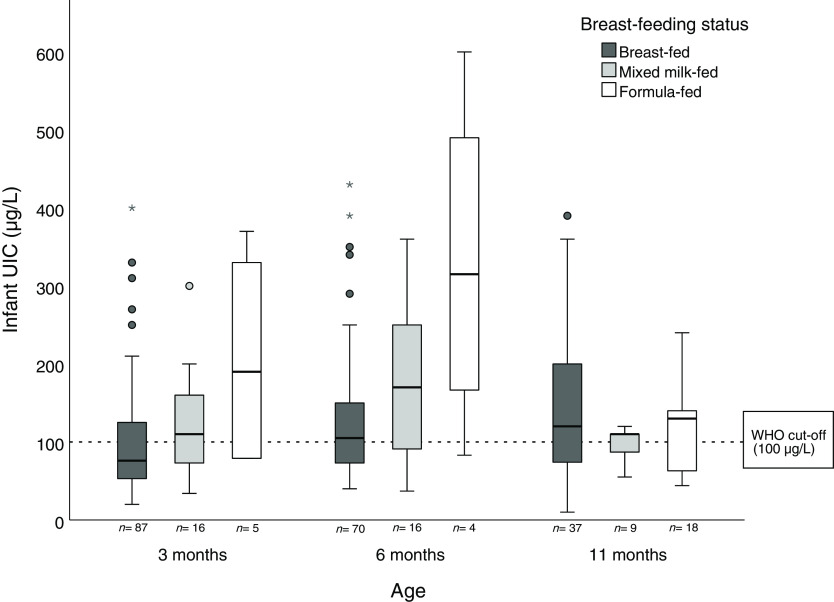
Fig. 1.
Box plot of infant urinary iodine concentration (UIC) at ages 3, 6 and 11 months by breast-feeding status categories. The boxes indicate the upper (75th percentile) and lower (25th percentile) quartiles with the thick black line as the median (50th percentile). The T-bars indicate 1·5 × length of the box (interquartile range). The filled circles are outliers, defined as a value > 1·5 length of the box. The asterisks are extreme outliers, defined as a value > 3·0 length of the box.

