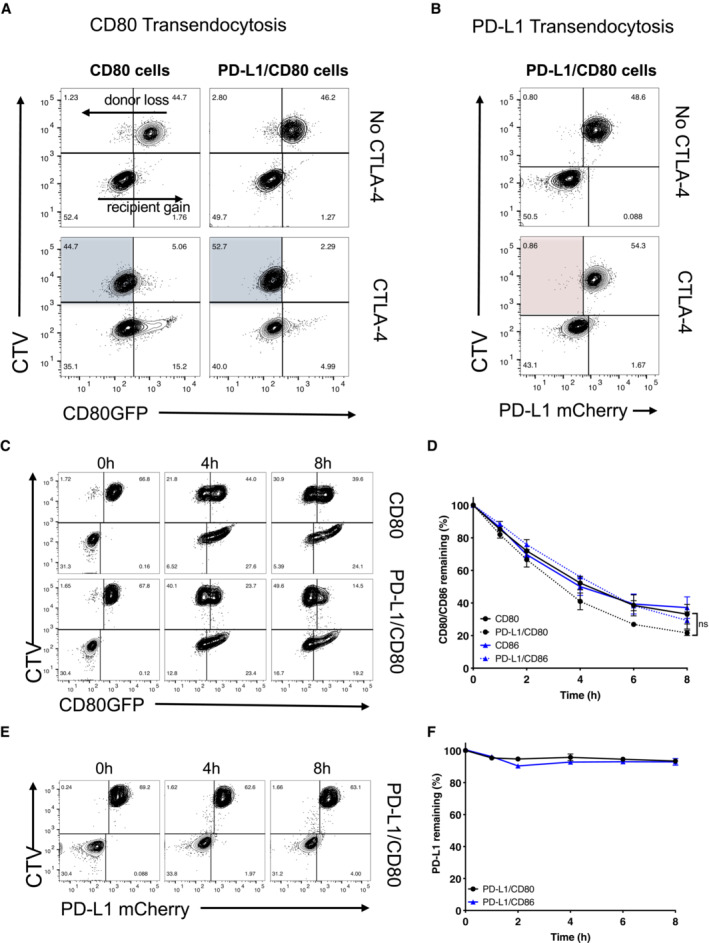
Figure 2. Transendocytosis of CD80 is not inhibited by PD‐L1 co‐expression.

-
ATransendocytosis assays were carried out overnight (as detailed in EV2) using CHO donor cells (CD80GFP alone or CD80GFP with PD‐L1mCherry co‐expression) incubated with CTLA‐4 recipient cells at a ratio of 1:1. Recipient cells either lacked CTLA‐4 (No CTLA‐4) or expressed CTLA‐4. FACS plots show CD80GFP ligand loss from donor cells highlighted in blue quadrants in the presence of CTLA‐4+ recipients.
-
BAssays as in (A) but showing PD‐L1 expression following CD80 transendocytosis (red shaded quadrant).
-
C–FTransendocytosis assays were performed at a ratio of 2 donor:1 CTLA‐4 recipient for the times indicated. (C), Representative FACS plots showing CD80GFP levels and (D) full kinetic analysis of CD80 or CD86 downregulation on donor cells quantified as a percentage relative to no CTLA‐4 control (mean ± SEM, three independent experiments, ns, not significant: two‐way ANOVA with Tukey's multiple comparisons test). (E) Representative FACS plots showing PD‐L1mCherry level at time points indicated. (F) Full kinetic analysis of PD‐L1mCherry level on donor cells (mean ± SEM, three independent experiments).
