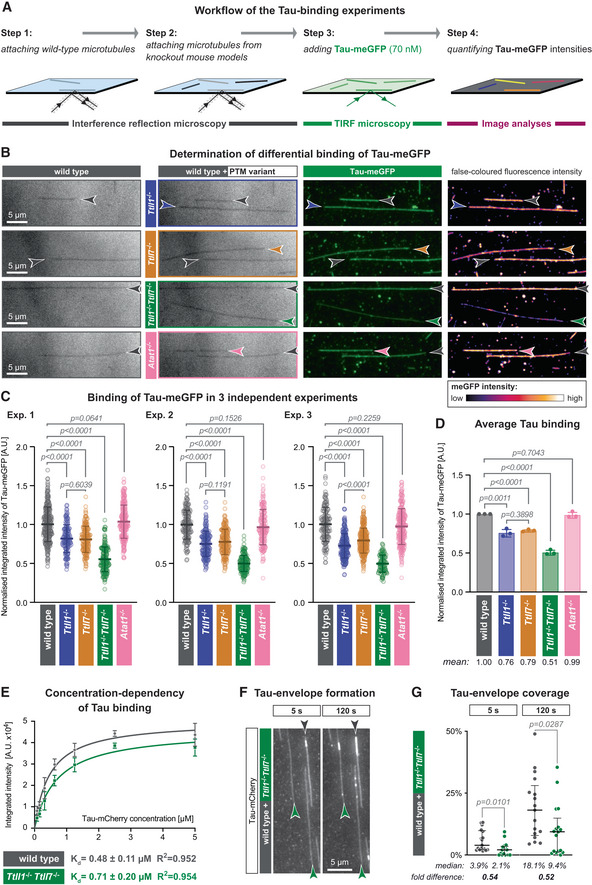
Figure 2. Polyglutamylation controls the affinity of Tau protein to microtubules.

- Schematic representation of the TIRF microscopy assay setup. Label‐free GMPCPP‐stabilised microtubules, polymerised from wild‐type and knockout‐mouse brain tubulin, are attached to a glass coverslip chamber sequentially and imaged in IRM mode. Their identity is retained by their positions on the coverslip (Steps 1 and 2). Next, 70 nM purified Tau‐meGFP is added to the chamber and its microtubule binding recorded in TIRF microscopy mode (Step 3). The fluorescence intensity of Tau‐meGFP on each microtubule in the chamber is measured in the subsequent affinity analysis (Step 4).
- Representative IRM and TIRF microscopy images showing microtubule positions and Tau‐meGFP intensities for different PTM variants (grey: wild type; blue: Ttll1 −/−; yellow: Ttll7 −/−; green: Ttll1 −/− Ttll7 −/−; pink: Atat1 −/−). In the last column, false‐coloured TIRF images highlight differences in Tau‐meGFP intensities on different types of microtubules (Movie EV1). Scale bars 5 μm.
- Quantification of the integrated intensity of Tau‐meGFP on GMPCPP microtubules in three independent sets of experiments performed with independently purified tubulin samples. Single assays (Fig EV2A) of one experiment were combined after normalisation to the wild‐type microtubule values (A.U., arbitrary units). Each data point represents the normalised fluorescence intensity value of one microtubule. Mean values and standard deviation are shown for each scatter plot. Student's t‐test; P‐values displayed.
- Summary quantification of the three independent experiments shown in (C). Each point is a normalised mean of the triplicates, and error bars represent standard deviation. Student's t‐test; P‐values displayed.
- Saturation curve of increasing concentration Tau‐mCherry binding to GMPCPP wild‐type and Ttll1 −/− Ttll7 −/− microtubules. Each data point is shown as mean ± standard deviation of the raw integrated intensity values (A.U. × 104) of three experiments with independently purified tubulin samples (Fig EV2D). Dissociation constants K d and R 2 coefficient from non‐linear fits of each microtubule type are indicated below the plot.
- Tau‐envelope formation on Taxol‐stabilised wild‐type and Ttll1 −/− Ttll7 −/− microtubules (grey and green arrowheads, respectively) 5 and 120 s after the addition of 40 nM Tau‐mCherry to the TIRF microscopy flow‐chamber (Movie EV2). Scale bars 5 μm.
- Analysis of percentage total microtubule length in the flow‐chamber covered by Tau envelopes. Pooled data points from three experiments (each data point represents tau coverage of microtubules within one field of view) with medians and interquartile ranges represented. Mann–Whitney test, P‐values displayed.
