
Figure EV2. Additional assays on Tau‐microtubule interactions (complement to Fig 2).
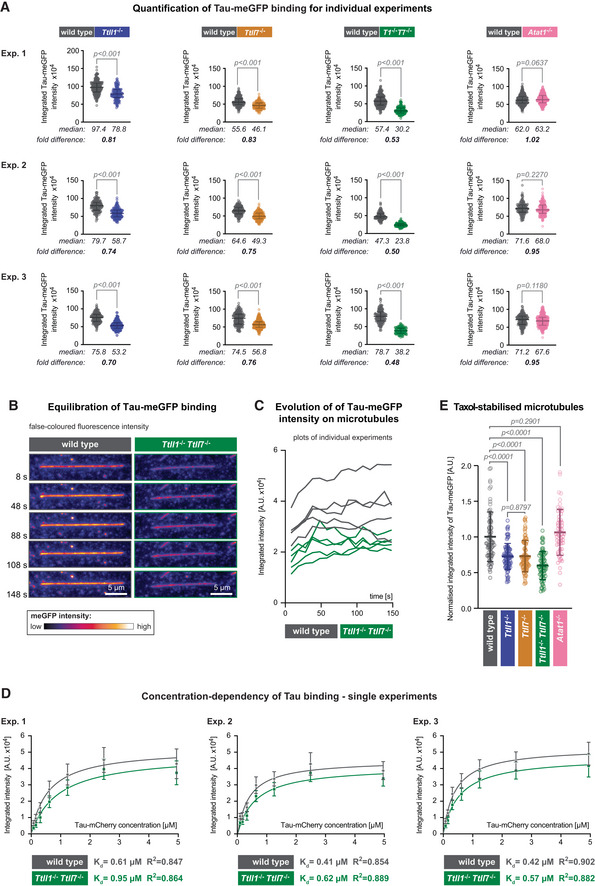
- Quantification of the integrated intensity of Tau‐meGFP on GMPCPP microtubules shown for the single assays that were combined in Fig 2C after normalisation to the median values measured on wild‐type microtubules. Three independent sets of experiments were performed with independently purified tubulin samples. Each data point represents the quantification of one microtubule. Median values and interquartile ranges are shown for each scatter plot. Mann–Whitney test, P‐values displayed.
- Representative still images from a time lapse of Tau‐meGFP binding to GMPCPP microtubules. The images are false coloured to better reveal the intensity evolution over time. Scale bars 5 μm.
- Raw integrated intensity values (A.U. × 104) of Tau‐meGFP binding to GMPCPP wild‐type and Ttll1 −/− Ttll7 −/− microtubules over a 150 s time interval (data points every 10 s). For each type 5 microtubules from the same assay were analysed.
- Saturation curves from individual experiments with microtubules from independently purified tubulin samples. Increasing concentration Tau‐mCherry binding to GMPCPP wild‐type and Ttll1 −/− Ttll7 −/− microtubules were quantified in one assay with each of the shown concentrations per experiment. Each data point is a mean (±standard deviation) of the raw integrated intensity values of single microtubules for the respective concentration (A.U. × 104). The derived dissociation constants K d and R 2 coefficient from the nonlinear fit for each microtubule type are indicated below the plots. The means of the three independent experiments shown here are combined in Fig 2E.
- Quantification of normalised integrated intensity of Tau‐meGFP fluorescent intensity on Taxol‐stabilised microtubules. Data of individual assays were normalised to mean values from wild‐type microtubules, and then combined as in Fig 2C. Each data point represents a single microtubule measurement from one experiment (n = 57–80 microtubules). Scatter plots with mean values (A.U.) and standard deviation. Student's t‐test, P‐values are shown.