
Figure EV3. Individual katanin severing assays (complement to Fig 3).
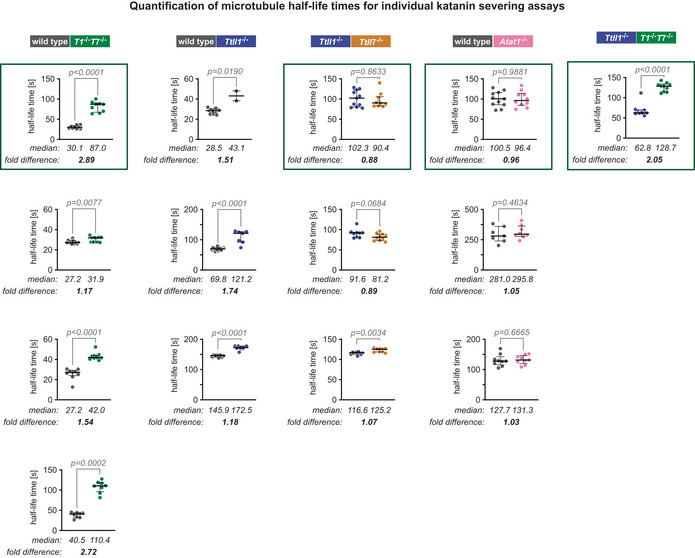
Representation of all individual quantifications of microtubule length half‐life times in the presence of 100 nM p60/p80 katanin separately for all 14 experiments. As shown in Fig 3A, two types of microtubules were always compared in the same chamber to mitigate the variability of katanin and microtubule concentrations in different measurement channels and, thus, ensure comparability between the samples. Each data point represents the half‐life time of one microtubule determined as shown for representative examples in Fig 3B, with bars representing medians and interquartile ranges. Mann–Whitney test, P‐values are shown. Selected plots (green frames) are shown in Fig 3D. To adjust all assays for a comparative analysis shown in Fig 3E, values were normalised to wild‐type microtubules. To normalise assays not including this type of microtubules, we used the weighted median fold difference between wild‐type and Ttll1 −/− microtubules from three independent experiments (second column) which provided the factor 1.45. This factor was used to normalise values in experiments omitting wild‐type, but including Ttll1 −/− microtubules.