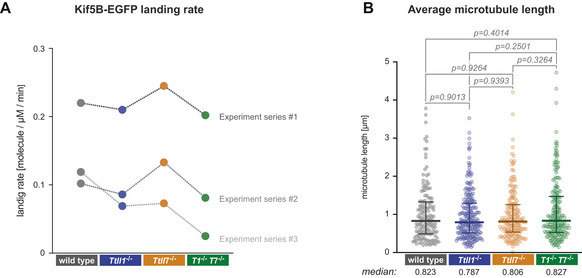
Figure EV4. Additional parameters for kinesin‐1 motility assays (complement to Fig 4).

- Comparison of the Kif5B‐EGFP landing rates in three independent sets of experiments. Landing rates were calculated by summing up the total number of single‐molecule Kif5B‐EGFP landing events on microtubules relative to the total (summed up) length of microtubules in the field of view and the observation time. Note that landing rates differ between different sets of experiments, but are mostly similar for different PTM subtypes of microtubules within all experimental sets.
- Median microtubule length (each data point represents one microtubule) determined from all microtubules observed in three independent sets of experiments. Medians with interquartile ranges shown, Mann–Whitney test and P‐values displayed.
