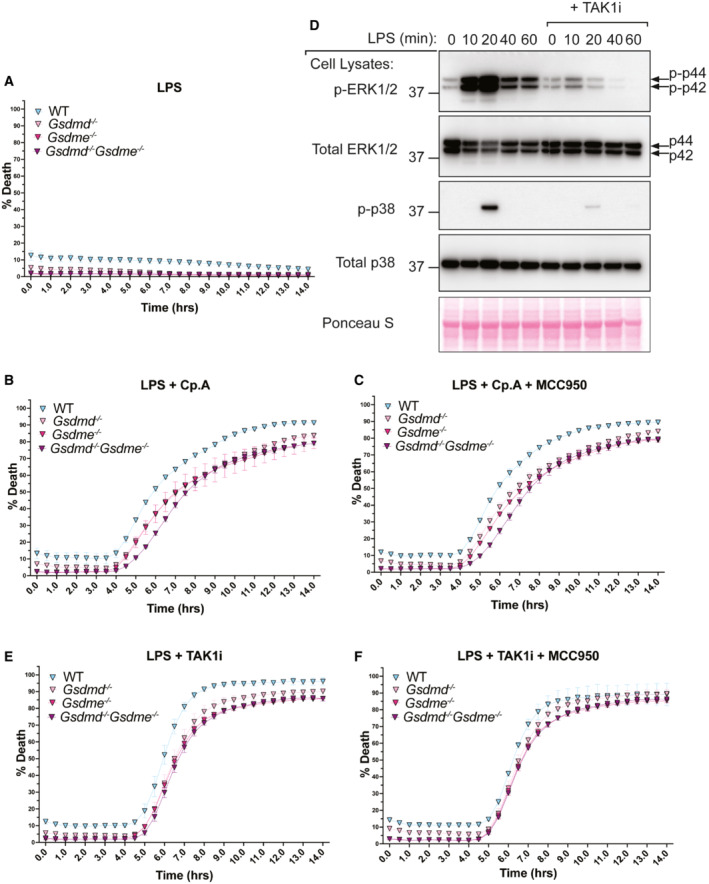
Figure EV2. Loss of GSDMD and GSDME does not prevent caspase‐8‐mediated cell death upon IAP loss or TAK1 inhibition.

-
A–CBMDMs of the indicated genotypes were seeded at a density of 7.5 × 10⁴ cells per well and treated with LPS alone (A) or primed with LPS (100 ng/ml) for 3 h before treatment with either Cp. A (1 μM) (B) or with Cp. A and MCC950 (5 μM) (C). Cell viability was determined through IncuCyte analysis and measured as the proportion of Cytotox Green positive cells versus SPY620‐DNA positive cells. Each graph is representative of three independent experiments, data points represent the mean of triplicate wells. Error bars are the mean ± SD.
-
DBMDMs were seeded at a density of 4 × 10⁵ cells per well and pre‐treated with TAK1i (250 nM) for 1 h prior to the addition of LPS (100 ng/nl) for 0, 10, 20, 40 and 60 min. Cell lysates were collected and analysed by western blot. Data represent one experiment.
-
E, FBMDMs of the indicated genotypes were seeded at a density of 7.5 × 10⁴ cells per well and primed with LPS (100 ng/ml) for 3 h before treatment with either TAK1i (250 nM) (E) or with TAK1i and MCC950 (5 μM) (F). Cell viability was determined through IncuCyte analysis and measured as the proportion of Cytotox Green positive cells versus SPY620‐DNA positive cells. Each graph is representative of three independent experiments, data points represent the mean of triplicate wells. Error bars are the mean ± SD.
Source data are available online for this figure.
