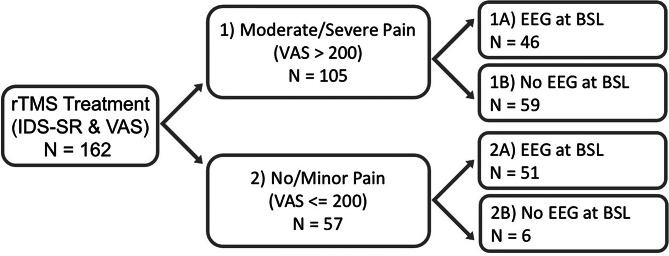
Fig. 1.
Breakdown of total sample into subgroups. The total sample of N = 162 was split into Groups 1 and 2 based on the presence of pain symptoms (cutoff: VAS>200). Each subgroup was further divided depending on whether subjects had a baseline EEG recording (Groups 1A and 2A) or not (Groups 1B and 2B).

