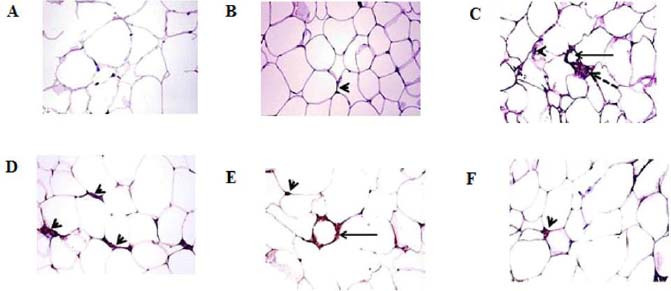
Fig. 5.

Photomicrograph of the visceral adipose tissues stained for CDllc shows crown (arrow), syncytial giant cell (dashed arrow), and resident adipose tissue macrophages (arrowhead) of (A) control group, (B) oleic acid group, (C) HFD group, (D) HFD-exercise group, (E) HFD-oleic acid group, and (F) HFD-exercise-oleic acid group. CD11c immunohistochemical staining, magnification 40×. HFD, High-fat diet.
