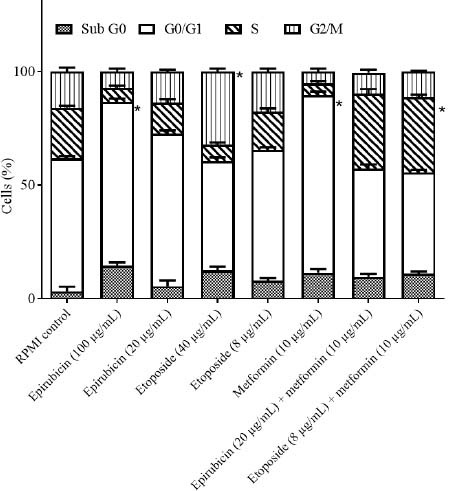
Fig. 8.

The effects of epirubicin and etoposide in single concentration (values are the real concentrations which are closest to calculated IC50 and one fifth of IC50) and in combination with metformin on cell cycle distribution of SW cell line after 48 h incubation. Data are presented as mean ± SD. *P < 0.05 Indicate significant differences compared to RPMI as the control group.
