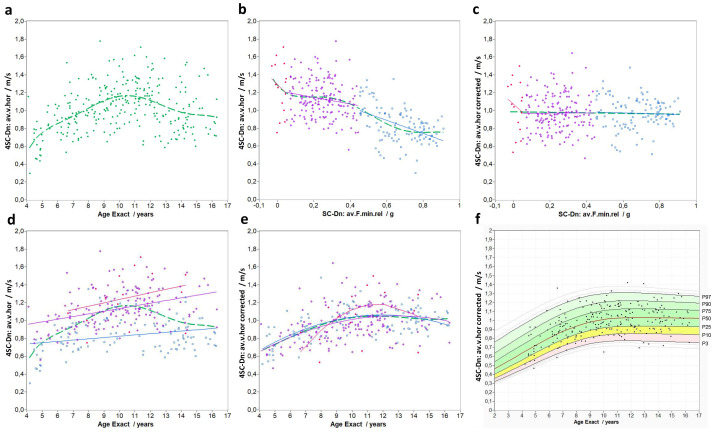
Figure 2.
4SC-Dn data for av.v.hor: a) vs age, b) vs. av.F.min.rel including sub-groups of slow walkers (blue squares), fast walkers (purple hollow circles) and runners (red circles) c) after compensation of group differences d) vs. age including linear interpolation per sub-group e) after compensation f) resulting age-independent reference data (percentiles).

