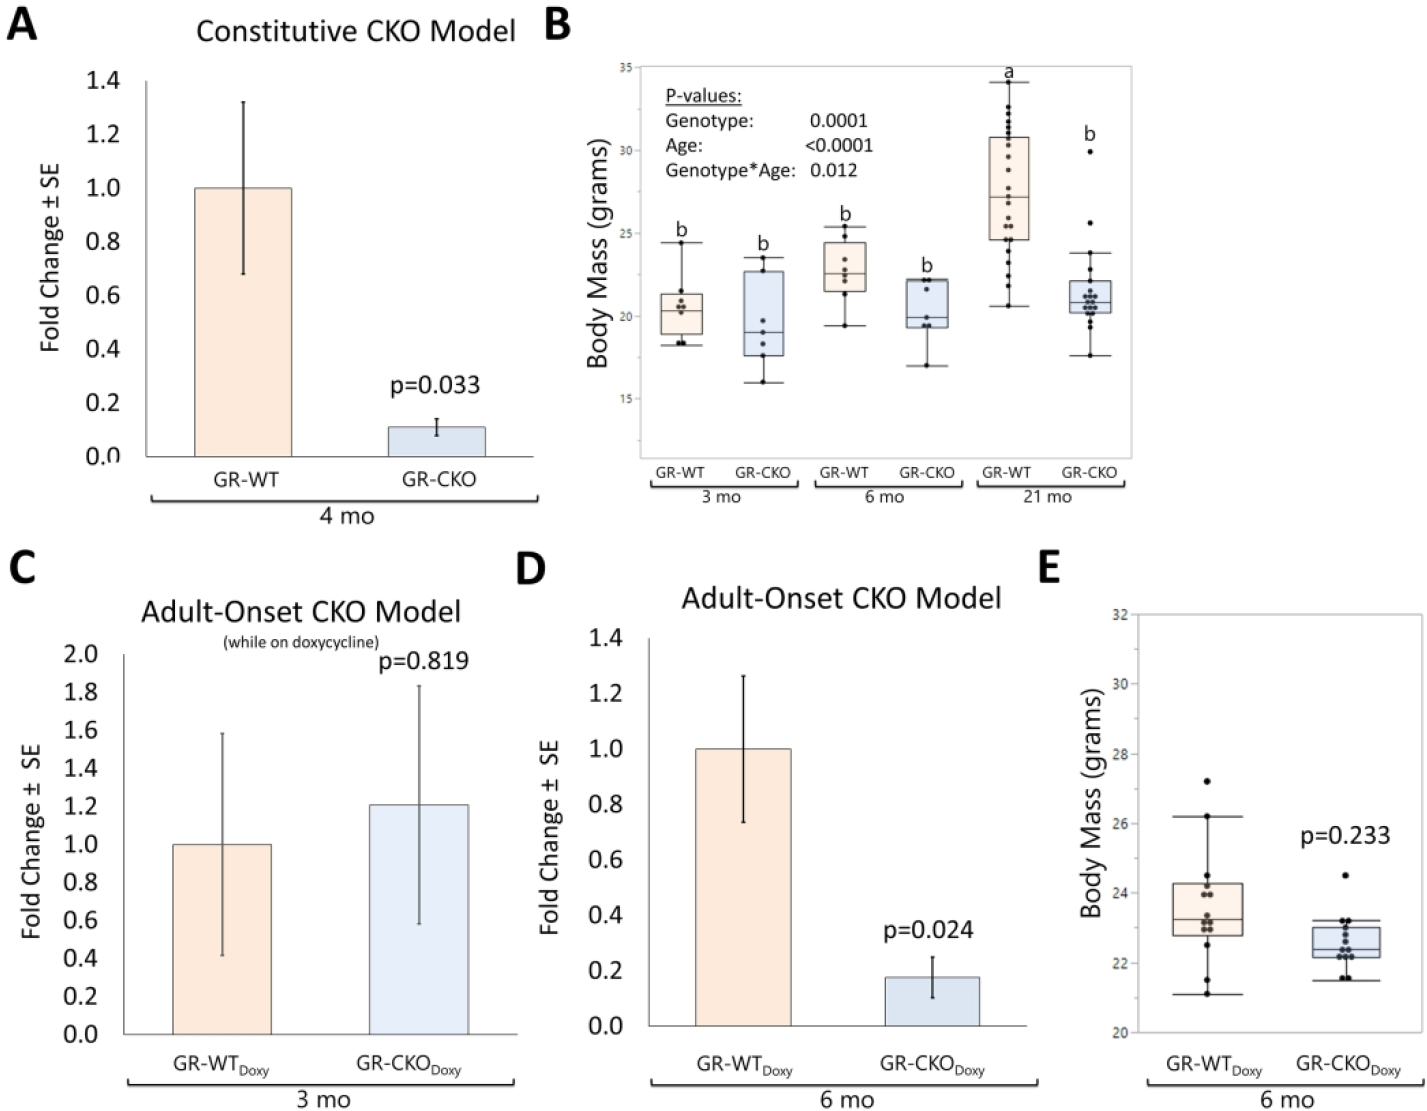
Figure 1: Validation of GR-CKO in bone.

(A) RT-qPCR analysis of the glucocorticoid receptor (GR) exon 2 in cortical bone samples from young female (4 months) constitutive GR-WT and GR-CKO (n=4) mice maintained on a regular diet. (B) Body mass (in grams) of constitutive GR-CKO and GR-WT littermates at 3, 6, or 21 months of age. Bars with different superscript letters are significantly (p<0.05) different from one another. (C) Expression levels of the GR in cortical bone from adult-onset GR-WT and GR-CKO mice (n=3) maintained on a doxycycline diet for 3 months until sacrifice (i.e., mice remained on doxycycline until sacrifice). (D) GR expression levels in cortical bone from 6-month-old GR-WT and GR-CKO mice (n=4) that were subjected to a doxycycline diet for 3 months followed by a 3 month recovery period on a regular diet with no doxycycline to permit Cre expression. (E) Body mass (in grams) of female adult onset GR-WT and GR-CKO mice at 6 months of age, 3 months after cessation of the doxycycline diet. Boxes show median, quartiles and outlier fences for each dataset, whereas bar charts show group mean +/− SEM. Each data point represents one mouse.
