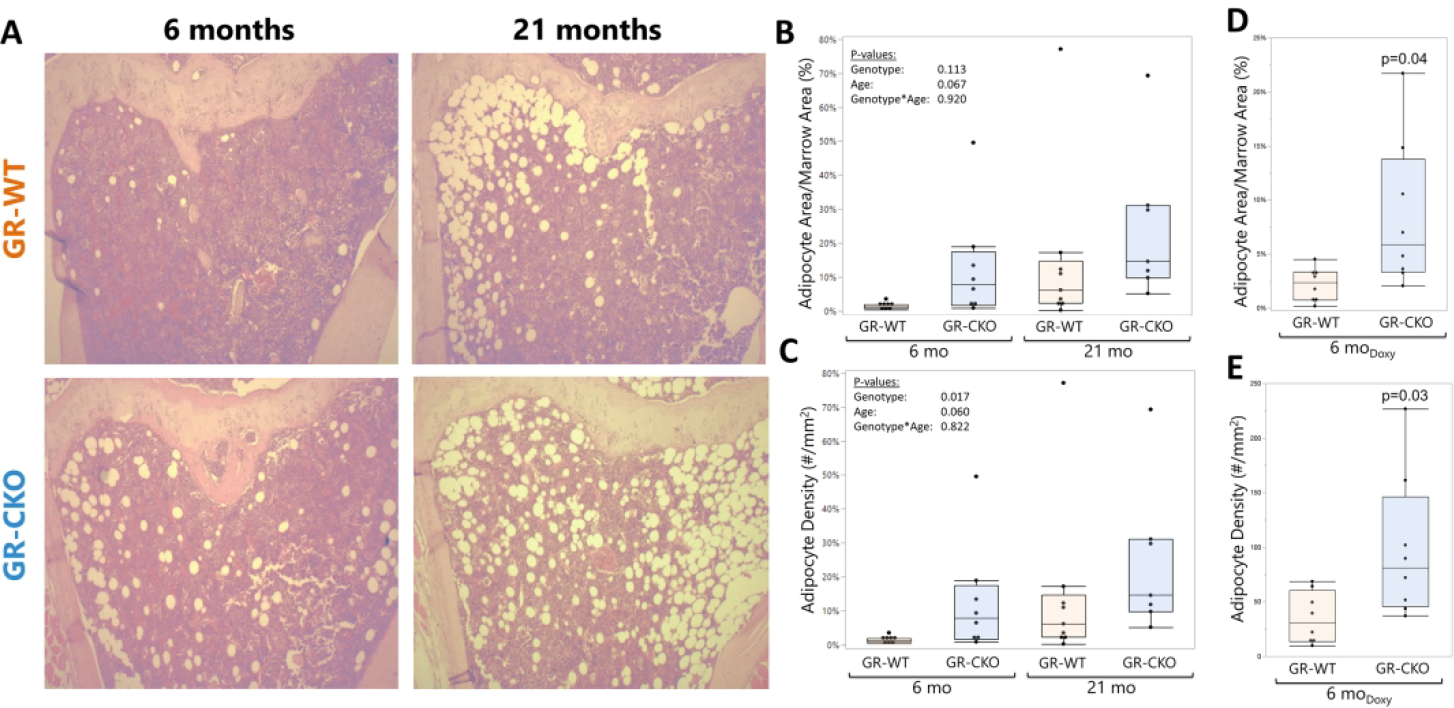
Figure 4: GR-CKO mice accumulate increased bone marrow fat that persists with aging.

(A) Representative images for H&E-stained tibial sections from constitutive GR-WT and GR-CKO mice at 6- and 21 months of age. Quantification of (B) adipocyte area fraction (Ad.Ar/M.Ar, %) and (C) adipocyte density (#/mm2) of the proximal tibiae in the constitutive GR-CKO and WT mice was performed using Bioquant Osteo. (D) Adipocyte area fraction and (E) adipocyte density were also quantified in the proximal tibiae of the 6-month-old adult-onset GR-CKO and GR-WT mice (3 months of doxycycline diet followed by 3 months of normal diet to induce Cre expression). Boxes show median, quartiles and outlier fences for each dataset. Each data point represents one mouse.
