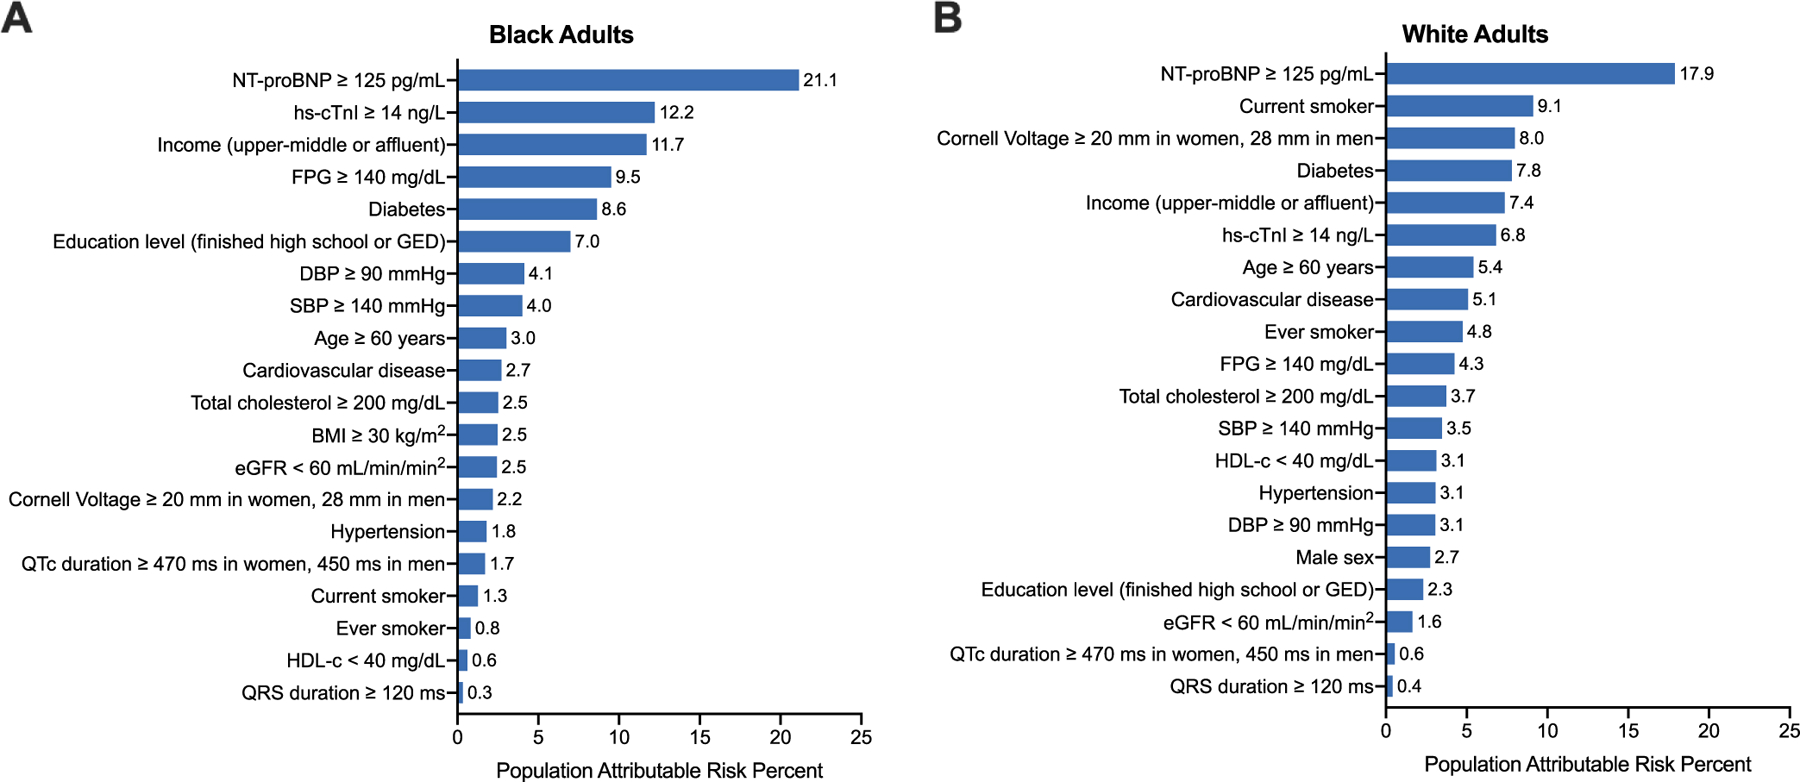
Figure 4. Results of the Monte Carlo simulation to calculate the population attributable risk percent of each covariate among (Panel A) Black and (Panel B) White adults.

Simulation values were obtained based on patient characteristics from Black and White adults from the ARIC cohort. The referent group was the group opposite the listed cutoff.
Abbreviations: BMI, body mass index; CVD, cardiovascular disease; FPG, fasting plasma glucose; HDL-c, high density lipoprotein cholesterol; NP, natriuretic peptide
