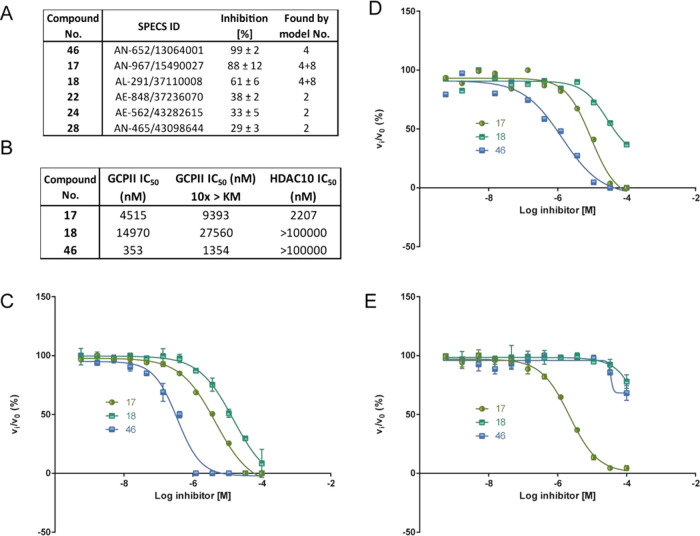
Figure 5.
Enzymatic profiling of selected hits. (A) Inhibitory potency of the active compounds against GCPII. (B) IC50 values of the three most potent compounds for GCPII, and substrate concentration at KM, GCPII and substrate concentration 10 times above the KM, and against HDAC10. The respective full-dose–response inhibition curves are presented in panels (C), (D), and (E).

