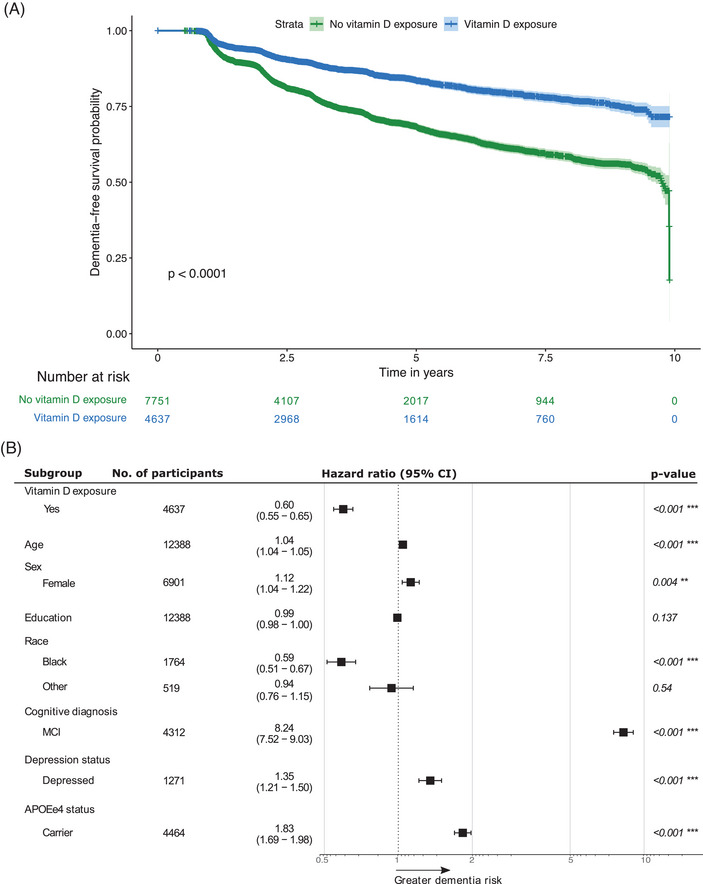
FIGURE 2.

(A) KM curve of dementia‐free survival over 10 years, stratified by exposure to vitamin D. (B) Adjusted HR for dementia across vitamin D exposure groups. The reference groups were the non‐exposed group (N = 7,751) for vitamin D exposure, male (N = 5,487) for sex, White (N = 10,105) for race, NC (N = 8,076) for cognitive diagnosis, non‐depressed group (N = 11,117) for depression status, and non‐carriers (N = 7,924) for APOE ε4 status. Error bars represent the 95% CI. The star notation indicates statistical significance. APOE, apolipoprotein E; CI, confidence interval; HR, hazard ratio; KM, Kaplan–Meier; MCI, mild cognitive impairment; NC, normal cognition.
