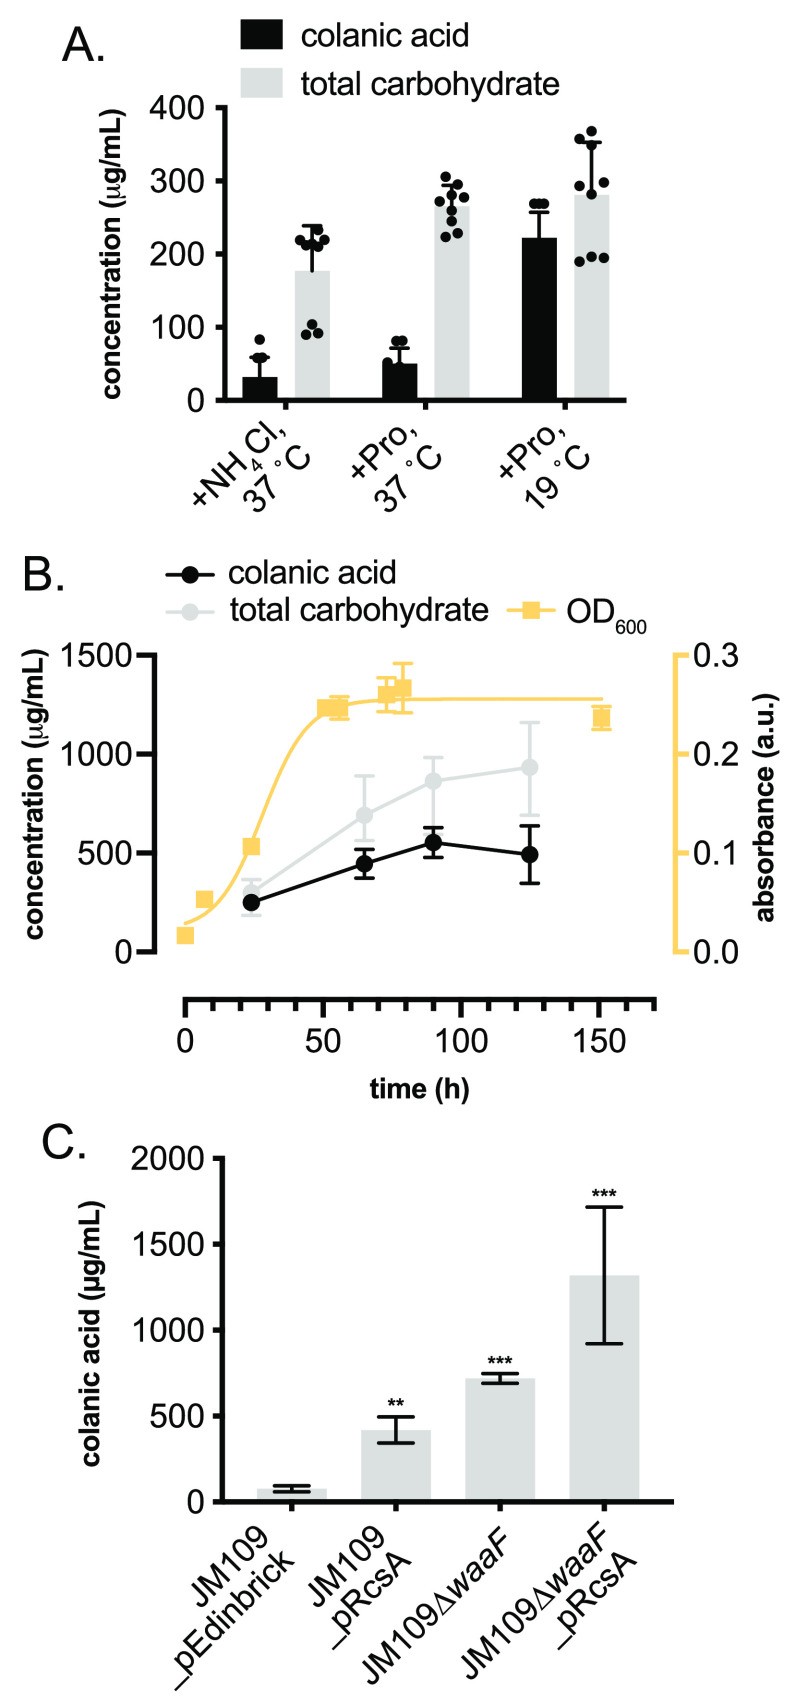
Figure 3.
(A) Temperature and N-source screen to increase total carbohydrate and CA production in E. coli JM109_pRcsA. (B) CA production over time related to culture growth phase and total carbohydrate production. (C) Strain optimization to enhance CA production. CA was quantified by measuring fucose concentration in hydrolyzed samples by derivatization of extracted EPS with Cys·HCl and measuring the difference in absorbance at 427 and 396 nm. Total carbohydrate was quantified via the anthrone assay and measuring the absorbance at 620 nm. Data from quantitative experiments are presented as averages of three independent experiments to one standard deviation. *P < 0.05, **P < 0.005, ***P < 0.0005..

