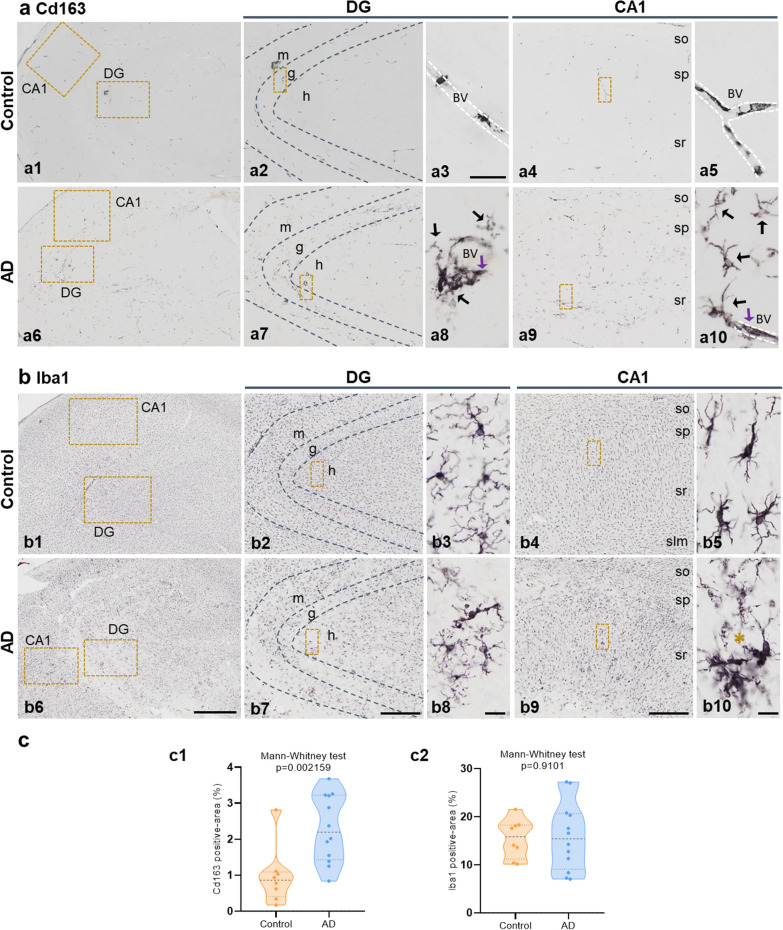
Fig. 2.
Presence of Cd163-positive cells in the hippocampal parenchyma of AD hippocampus. (a) Immunostaining for CD163 in Braak II (age-matched controls, a1–5) and Braak V–VI (AD patients, a6–10) hippocampus. Cd163-positive cells from Braak II individuals (a1) were limited to blood vessels in both DG (a2, boxed area a3) and CA1 (a4, boxed area a5) areas. AD samples (a6) showed Cd163 cells not only associated with blood vessels (purple arrows in a8 and a10), but also distributed throughout the hippocampal parenchyma (black arrows in a8 and a10). (b) Immunolabeling for Iba1 in the hippocampus of control (b1–5) and AD (b6–10) individuals. Iba1-microglial cells from Braak II cases (b1) exhibited a homogenous distribution (b2 and b4, boxed areas b3 and b5) compared to AD hippocampus (b6) which included degeneration (b7, boxed area b8) and clustering (b9, boxed area b10). (c) Quantitative analysis of the parenchymal area (percentage) covered by Cd163 (c1) and Iba1 (c2) positive cells in control (n = 8) and AD (n = 12) samples. The results are shown as violin plots including the individual cases (dots). Mann–Whitney U test comparison between control and AD groups. BV: blood vessels; CA1: cornu ammonis; DG: dentate gyrus; g: granular layer; h: hilus; m: molecular layer; so: stratum oriens; sp: stratum pyramidale; sr: stratum radiatum; slm: stratum lacunosum-moleculare.* Asterisk indicates Abeta plaque. Scale bars: a1, a6, b1 and b6, 1 mm; a2, a4, a7, a9, b2, b4, b7 and b9, 500 μm; a3, 50 μm; a5, a8, a10, b3, b5, b8 and b10, 20 μm

