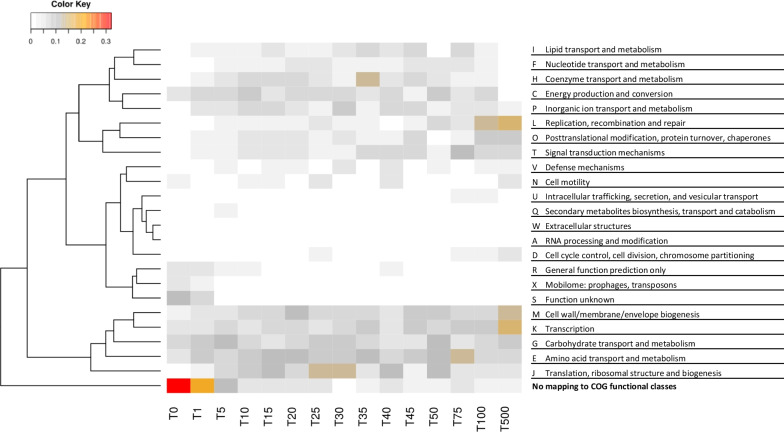
Fig. 3.
The heatmap profile of genes’ COG functions in each FPE score range. The heatmap coloring represents the percentage of genes in each COG category for each FPE score range (i.e., sum of the percentages for each column is one). Thus, the respective E. coli genes in each FPE score range are identified first. Then, they are categorized to the COGs according to the COG database sequence models and, subsequently, the COG functional code is associated with the gene. The genes without mapped COG function are classified as “UNMAPPED”. The heatmap shows the ratio of the number of genes with a given COG functional code in a given FPE score range to the total number of genes within that particular FPE score range. The color ranges from white (very low), grey (low), orange (high) to red (very high). The highly studied genes are overrepresented in the functional code M (cell wall/membrane/envelope biogenesis), K (transcription) and L (replication, recombination and repair). This is probably expected as it is related to bacterial pathogenesis and replication. The understudied genes are overrepresented in the function code Q (secondary metabolites biosynthesis, transport and catabolism), W (extracellular structures), A (RNA processing and modification), X (mobilome), and U (intracellular trafficking, secretion and vesicular transport). This suggests that there are still plenty of opportunity in the study of bacteria's secondary metabolites as well as mobilome-related functions

