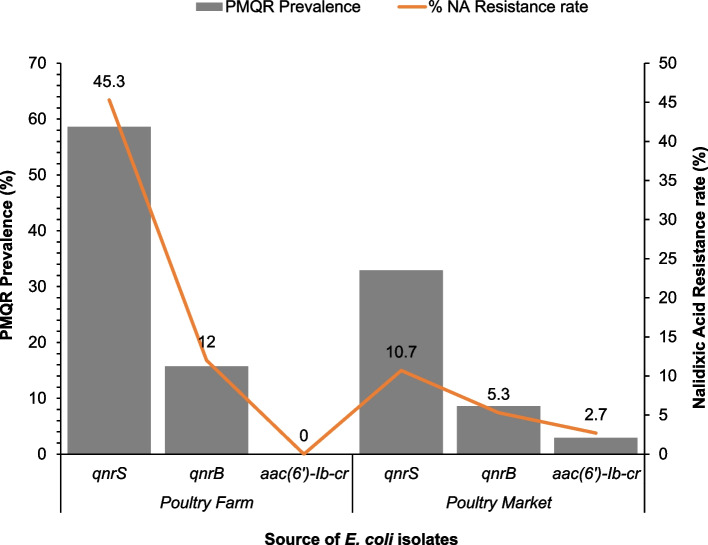
Fig. 2.
Distribution of 70 PMQR genes among 75 nalidixic acid-resistant Escherichia coli isolates originating from humans, chickens and poultry farms/ markets. This chart highlights the prevalence of PMQR among nalidixic acid-resistant E. coli isolates from all sample types originating from poultry farms/markets in Abuja, Nigeria, 2019. The prevalence of PMQR is plotted as bars on the primary axis while the nalidixic acid resistance rate in percentage is plotted as a line graph on the secondary axis. The various data points on the line graph are also displayed on the chart

